
Archived Content
Information identified as archived is provided for reference, research or recordkeeping purposes. It is not subject to the Government of Canada Web Standards and has not been altered or updated since it was archived. Please contact us to request a format other than those available.
Overview of the Census of Population
Chapter 9 – Census geography
Table of contents
Introduction
There is a geographic component to every stage of the census cycle, from consultation through collection, processing and dissemination. Users are consulted about the geographic concepts used by Statistics Canada and about various options for disseminating standard geographic data. Small geographic areas are defined and mapped in detail so every dwelling can be located during the data collection phase. During the processing phase, the collected data are coded to the appropriate geographic areas in the hierarchy of geographic units used for dissemination. Finally, census data are disseminated by a variety of geographic areas, along with supporting reference maps and other geographic data products.
To take full advantage of census data, users need to have a basic understanding of the geographic dimension of the data. Just as one can subdivide a population by sex, or into age and language groups, one can subdivide a population by different geographic areas. The geographic areas used by the census range in size from provinces and territories down to dissemination blocks, and are organized in a hierarchical model to show the nature of their relationships.
Hierarchical model of geographic areas
Standard geographic areas and their relationships to one another are depicted in Figure 1 Hierarchy of standard geographic units for dissemination.
- Each box in the hierarchy chart represents one type of geographic area.
- The relative position of each type of geographic area in the chart shows how it can be subdivided or aggregated to form other geographic areas. For example, the 13 provinces and territories are subdivided into 308 federal electoral districts (federal ridings), which in turn are subdivided into 493,345 dissemination blocks.
- The lines joining the boxes in the chart show that there is a relationship between the geographic areas at one level and those at the next level. In general, this is a 'one-to-many' relationship moving from top to bottom of the chart. From bottom to top, the relationship is 'many-to-one.'
- Each branch of the hierarchy shows there is no relationship between the geographic areas in that branch and those in an adjacent branch. For example, the chart shows that dissemination areas (DAs) group together to form census subdivisions (CSDs); they also group together to form census tracts (CTs), but there is no relationship (no exact fit) between CSD boundaries and CT boundaries.
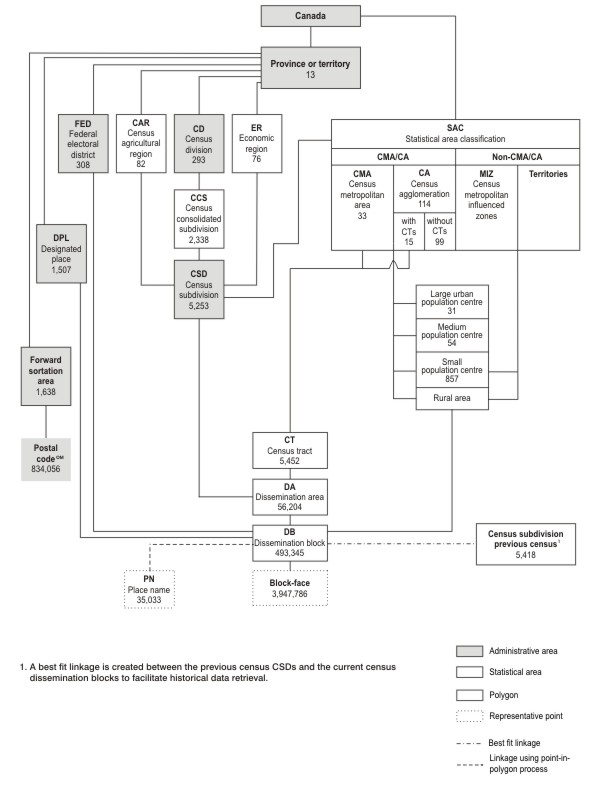
Figure 1 Hierarchy of standard geographic units for dissemination, 2011 Census
Description
Figure 1 is a graphical representation of the hierarchical relationship between the standard geographical units used for the dissemination of the 2011 Census of Canada. Each geographic unit is represented in the hierarchy by a box, which is appropriately labelled with the unit name as well as its related acronym. Where applicable, the labels are formatted in two rows. The top row contains the acronym of the geographic unit appearing in bold font and the second row contains the full name of the geographic unit in regular font.
In total, there are 19 boxes stacked both horizontally and vertically. Boxes that represent administrative areas are shaded grey. The boxes that represent statistical areas are white.
The position of each geographic unit in the hierarchy shows how it is related to other units. Most geographic units can be subdivided or aggregated to form other geographic units. The lines joining the boxes in the hierarchy show that there are relationships between the geographic units. When two boxes are not joined together by a line, then no relationship exists between those geographic units. A solid line indicates a direct relationship between two units. A dashed line indicates that two units are connected using a point-in polygon process. A dashed and dotted line (dash dot dash dot, etc.) indicates a best fit relationship between two geographic units.
In general, there is a 'one-to-many' relationship of geographic units as you move from the top to the bottom of the hierarchy diagram, and a 'many-to-one' relationship as you move from the bottom to the top.
The box centred at the top of the hierarchy represents the highest level of geography, Canada, which is shaded grey to indicate that it is an administrative area. Directly below the Canada box is the province or territory, which is also shaded grey. A solid line joins the Canada box to the province or territory box.
The province or territory box is connected to four other administrative areas on the left, including census division (CD), federal electoral district (FED), designated place (DPL) and forward sortation area. It is also connected to two statistical areas on the left, census agricultural region (CAR) and economic region (ER).
Each of these boxes, with the exception of the forward sortation area, is connected to one box or another that rolls down to be ultimately linked with the lowest level of dissemination geography, the dissemination block (DB) box, which is a statistical area. The forward sortation area is only connected to the postal code (OM: postal code is an official mark of Canada Post Corporation), an administrative area which has no further connections.
The DPL and the FED are connected directly to the DB, indicating that no other level of geography exists between them. The CD is connected first to the statistical area of the census consolidated subdivision (CCS), which is further connected to the administrative area of the census subdivision (CSD). The CAR and ER are also directly linked to the CSD. The CSD is linked directly to the dissemination area (DA), which is another statistical area. The DA is linked directly to the DB.
The Canada box is linked to one large statistical area box on the right, called the Statistical Area Classification (SAC). The SAC box is the most complicated box in the hierarchy since it encompasses four other statistical areas that make up all of Canada. These are categorized under two larger subcategories that indicate whether the area is part of a census metropolitan area/census agglomeration (CMA/CA) or is outside of a CMA/CA (non-CMA/CA).
The CMA/CA category is divided into two boxes, the CMA and the CA. The CA box is further subdivided into two other categories to indicate that CAs can be broken down into areas with census tracts (CT) and areas without CTs.
The non-CMA/CA category is also divided into two boxes, the census metropolitan influenced zones (MIZ) and the territories.
Below the SAC is a box that is subdivided into four stacked boxes that list the categories of population centres (POPCTR) in Canada. These include, from top to bottom, large urban population centre, medium population centre, small population centre and rural area. The CMA/CA boxes are directly linked to all categories of POPCTR, while the non-CMA/CA is directly linked only to the small population centre and rural area boxes. This complete set is linked directly to the DB.
Below the DB, there are three other geographic areas that are not used for disseminating data. Instead, they are linked to the DB to provide reference and/or geocoding information of census data. The place name (PN), which is a representative point, is linked to the DB by a dashed line, indicating linkage using a point-in-polygon process. The block-face, also a representative point, is linked directly to the DB. The census subdivision from the previous census is linked to the DB by a dashed-dotted line, which indicates a best-fit linkage.
Sources:
Statistics Canada, 2011 Census of Population,
Canada Post Corporation, May 2011.
Geographic analysis: from the general to the specific
A particular branch in the hierarchy shows how one can carry out geographic analysis starting with the general and moving to the specific (a top-down approach). For example, one can start with Canada and then, within each province or territory, look at census divisions (CDs) and CSDs. Or, using a bottom-up approach (building-block fashion), one can start by examining specific individual areas, CSDs for example, and comparing them with each other, within a particular CD, then within the province or territory, and eventually within the nation as a whole.
To put these descriptions in context, the following section describes the way in which Statistics Canada creates and maintains the geographic infrastructure.
Geographic database
The geographic areas depicted in the hierarchy chart are incorporated into a large geographic database, called the National Geographic Database (NGD). The NGD includes a digital representation of the boundaries of these areas, as well as attribute data, such as the names and codes, which are necessary for uniquely identifying each area.
The NGD contains additional geographic features, including the road network, various hydrographic features (such as lakes, rivers and coastal waters) and other selected visible features (for example, railroads). The additional features also have associated attribute data, such as street names and address ranges.
Geographic areas
In Figure 1, geographic areas are depicted as being either administrative or statistical areas. Administrative areas are defined, with a few exceptions, by federal, provincial or territorial statutes, and are adopted for the purposes of the census. Statistical areas, on the other hand, are defined by Statistics Canada, in cooperation with stakeholders, for the purpose of disseminating census data and complementing the structure of administrative regions.
The number of geographic areas by province and territory for the 2011 Census, is presented in the Geographic units by province and territory, Table 1 of the 2011 Census Dictionary, Catalogue no. 98‑301‑X.
Refer to the Geography universe section of the 2011 Census Dictionary, Catalogue no. 98‑301‑X, for definitions and more detailed information on each of the following administrative and statistical areas. Supplementary information is also provided in the appendices.
Administrative areas
- Province or territory
- Census division (CD)
- Census subdivision (CSD)
- Federal electoral district (FED)
- Forward sortation area (FSA)©
- Postal codeOM
- Designated place (DPL)
Statistical areas
- Economic region (ER)
- Census agricultural region (CAR)
- Census consolidated subdivision (CCS)
- Population centre (POPCTR)
- Statistical Area Classification (SAC)
- Census metropolitan area (CMA)
- Census agglomeration (CA)
- Census metropolitan influenced zone (MIZ)
- Census tract (CT)
- Dissemination area (DA)
- Dissemination block (DB)
- Place name (PN)
Collection geography
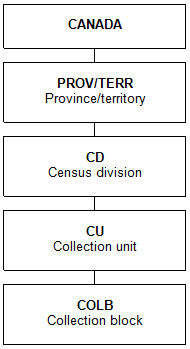
The geographic areas used for census data collection are illustrated below in Figure 2 Hierarchy of geographic units for collection, 2011 Census and are slightly different than those used for dissemination. Data are not published using collection-oriented geographic areas and therefore are not represented in the hierarchy of geographic units used for dissemination (Figure 1). The geographic areas used for census data collection include the collection unit (CU), the collection block (COLB) and supervisory areas for each field operation (Figure 2).
Figure 2 Hierarchy of geographic units for collection, 2011 Census
Non-standard or user-defined geographic areas
In most cases, the standard geographic areas described above satisfy data user requirements for census data tabulations; however, there are also many who require that data be tabulated for geographic areas that are not in the standard geographic hierarchy, depicted in Figure 1.
There are two basic types of such non-standard or 'user-defined' geographic areas: areas that are aggregations of standard geographic areas, and areas that do not match the standard geographic areas at all. An example of the first type could be sales regions for a metropolitan area, where the sales regions are made up of one or more census subdivisions. Examples of user-defined areas that do not match the standard geographic areas are market areas, school districts, and transportation and utility corridors. When clients require that census data be tabulated for non-standard geographic areas, they may turn to the Custom Area Creation Service provided by Statistics Canada (see Chapter 10 – Dissemination).
OM: Postal code is an official mark of Canada Post Corporation.
- Date modified: