
Mobility and Migration Reference Guide, Census of Population, 2016
Definitions and concepts
Geographic mobility refers to a population's geographic movement over time. The Census of Population collects information about a person's usual place of residence 1 year or 5 years prior to the census reference day. By comparing the place of residence at a past date with the place of residence on the census reference day, information can be obtained on geographic mobility, for example, mobility status (whether the person is living at the same usual place of residence as 1 year or 5 years ago) and past location of residence (1 year or 5 years ago).
Mobility data has been collected in every Canadian Census of Population between 1961 and 2016, with the exception of 1966. In 2011, mobility data was collected through the National Household Survey.
Mobility information collected with the census can be placed in two categories: mobility status 1 or 5 years ago and location of residence 1 or 5 years ago.
Mobility data pertaining to 1 year ago includes all persons 1 year of age and over living in private households. Mobility data pertaining to 5 years ago includes all persons 5 years of age and over living in private households.
Mobility status
Mobility status refers to the status of a person with regard to the place of residence on the reference day (May 10, 2016) in relation to the place of residence on the same date 1 year or 5 years earlier.
Persons who, on the reference day, lived in the same residence as on the same date 1 year or 5 years earlier are referred to as non-movers, and persons who, on the reference day, did not live in the same residence as they did 1 year or 5 years earlier are referred to as movers.
Movers include non-migrants and migrants. Non-migrants are movers who lived in the same census subdivision on the reference day as they did on the same date 1 year or 5 years earlier. Migrants include internal migrants and external migrants.
Internal migrants includes migrants who lived in Canada 1 year or 5 years ago. This includes persons who moved to a different city, town, township, village, municipality or Indian reserve within Canada. Greater detail can be provided for internal migrants by identifying if they have crossed a provincial boundary or the limits of a large municipality, specifically a census metropolitan area (CMA) or a census agglomeration (CA).
External migrants includes migrants who did not live in Canada 1 year or 5 years ago.
Description for Figure
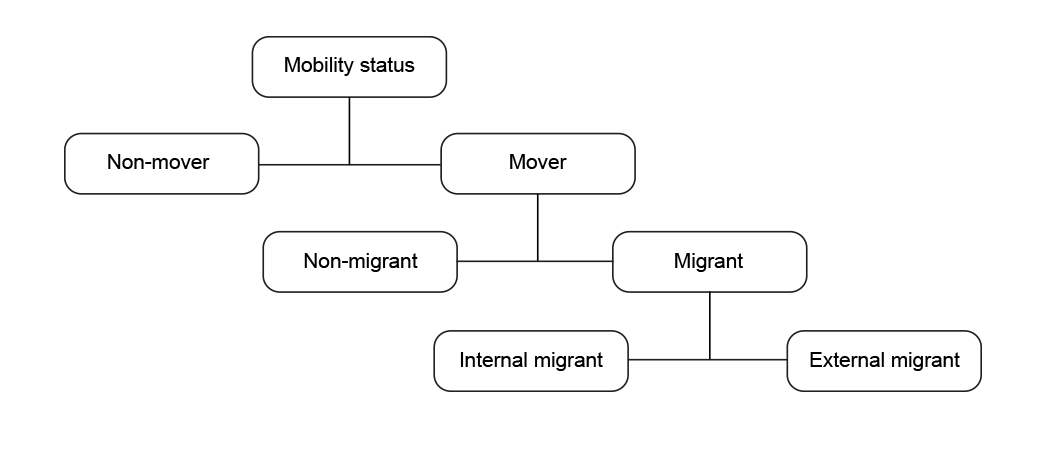
This figure illustrates the breakdown of Mobility status.
Mobility status is divided into movers and non-movers.
The status 'mover' is again divided into non-migrant and migrant.
Migrant is again divided into either internal migrant or external migrant.
Below is a list of mobility status concepts that either appear in disseminated tables or are available as custom data requests:
- Mobility 1 – Mobility status 1 year ago
- Mobility 1 – Interprovincial and intraprovincial mobility status 1 year ago
- Mobility 1 – Interprovincial and intraprovincial CMA mobility status 1 year ago
- Mobility 1 – Interprovincial and intraprovincial CMA and CA mobility status 1 year ago
- Mobility 5 – Mobility status 5 years ago
- Mobility 5 – Interprovincial and intraprovincial mobility status 5 years ago
- Mobility 5 – Interprovincial and intraprovincial CMA mobility status 5 years ago
- Mobility 5 – Interprovincial and intraprovincial CMA and CA mobility status 5 years ago
Location of residence
Location of residence refers to a person's usual place of residence 1 year or 5 years prior to census reference day.
Two categories of location of residence variables are produced for mobility 1 and 5 years ago: persons who resided in Canada and persons who resided outside Canada.
For persons who resided in Canada at the earlier time, location of residence 1 or 5 years ago is collected and coded as a seven-digit Standard Geographic Classification code (SGC). From this information, census subdivision of residence, census division of residence and province of residence 1 or 5 years ago is derived. Additionally, geographic information is produced pertaining to CMA of residence, Statistical Area Classification of residence and census subdivision type of residence 1 or 5 years ago.
For persons who resided outside Canada at the earlier time, country of residence 1 or 5 years ago is produced.
Below is a list of mobility location of residence variables that either appear in disseminated tables or are available as custom data requests:
- Mobility 1 – Statistical Area Classification of residence 1 year ago
- Mobility 1 – Census division of residence 1 year ago
- Mobility 1 – Census metropolitan area or census agglomeration of residence 1 year ago
- Mobility 1 – Census subdivision of residence 1 year ago
- Mobility 1 – Census subdivision type of residence 1 year ago
- Mobility 1 – Components of migration (in and out) 1 year ago
- Mobility 1 – Country of residence 1 year ago
- Mobility 1 – Province or territory of residence 1 year ago
- Mobility 5 – Statistical Area Classification of residence 5 years ago
- Mobility 5 – Census division of residence 5 years ago
- Mobility 5 – Census metropolitan area or census agglomeration of residence 5 years ago
- Mobility 5 – Census subdivision of residence 5 years ago
- Mobility 5 – Census subdivision type of residence 5 years ago
- Mobility 5 – Components of migration (in and out) 5 years ago
- Mobility 5 – Country of residence 5 years ago
- Mobility 5 – Province or territory of residence 5 years ago
Classifications
All mobility variables are based on Statistics Canada's standard definitions. These standards cover mobility status 1 and 5 years ago and location of residence 1 and 5 years ago variables. Below is a list of links to the Statistics Canada standard definitions for mobility and migration:
- Mobility status, one year
- Location of residence one year ago
- Mobility status, five years
- Location of residence five years ago
Questions
For 2016, the mobility questions are asked on the Census of Population long-form. Most long-form respondents received Form 2A-L questionnaire. Respondents living on Indian reserves, on Indian settlements and in other remote areas received Form 2A-R questionnaire.
Mobility and migration data were collected from Question 22, location of residence 1 year ago and Question 23, location of residence 5 years ago. The mobility questions are unchanged from 2011. See below screenshots for specifics on question layout and format.
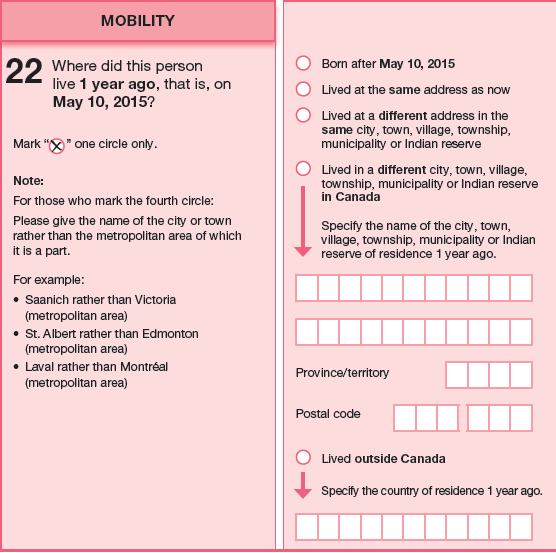
Description for Figure - Question 22
- The title of this figure is "Where did this person live 1 year ago, that is, on May 10, 2015?"
- This figure is a screenshot of Question 22 taken from the paper questionnaire.
- Mark "X" one circle only. Note: For those who mark the fourth circle: Please give the name of the city or town rather than the metropolitan area of which it is a part.
For example:
- Saanich rather than Victoria (metropolitan area)
- St. Albert rather than Edmonton (metropolitan area)
- Laval rather than Montréal (metropolitan area)
- To the right of the question text, there are 5 radio buttons where you select your answer. The options are:
- Born after May 10, 2015
- Lived at the same address as now
- Lived at a different address in the same city, town, village, township, municipality or Indian reserve
- Lived in a different city, town, village, township, municipality or Indian reserve in Canada. Specify the name of the city, town, village, township, municipality or Indian reserve of residence one year ago. Below this option, there is an edit field to enter the city, town, village, township, municipality or Indian reserve of residence. There are two other edit fields to enter the province or territory and the postal code.
- Lived outside Canada. Specify the country of residence 1 year ago. Below this option, there is an edit field to enter the country.
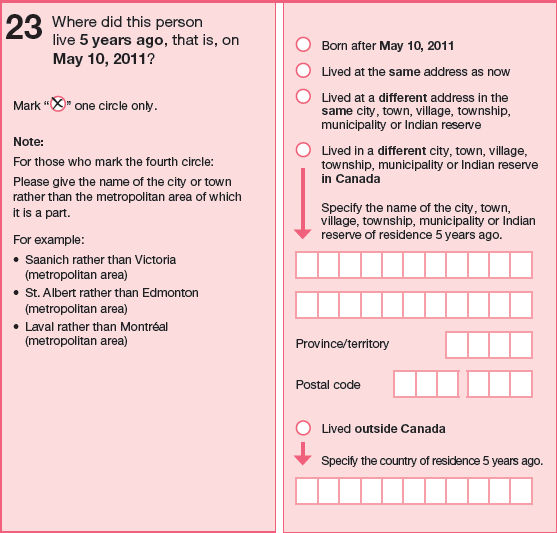
Description for Figure - Question 23
- The title of this figure is "Where did this person live 5 years ago, that is, on May 10, 2011?"
- This figure is a screenshot of Question 23 taken from the paper questionnaire.
- Mark "X" one circle only. Note: For those who mark the fourth circle: Please give the name of the city or town rather than the metropolitan area of which it is a part.
For example:
- Saanich rather than Victoria (metropolitan area)
- St. Albert rather than Edmonton (metropolitan area)
- Laval rather than Montréal (metropolitan area)
- To the right of the question text, there are 5 radio buttons where you select your answer. The options are:
- Born after May 10, 2011
- Lived at the same address as now
- Lived at a different address in the same city, town, village, township, municipality or Indian reserve
- Lived in a different city, town, village, township, municipality or Indian reserve in Canada. Specify the name of the city, town, village, township, municipality or Indian reserve of residence 5 years ago. Below this option, there is an edit field to enter the city, town, village, township, municipality or Indian reserve. There are two other edit fields to enter the province or territory and the postal code.
- Lived outside Canada. Specify the country of residence 5 year ago. Below this option, there is an edit field to enter the country.
Data quality
The 2016 long-form census questionnaire underwent a thorough data quality assessment, similar to what was done for the 2011 National Household Survey (NHS) and past censuses. A number of data quality indicators (briefly described below) were produced and used to evaluate the quality of the data.
The data quality assessment was done in addition to the regular quality checks completed at key stages of the survey. For example, during data collection and processing, the consistency of the responses provided was checked and the non-response rates for each question were analysed. As well, the quality of imputed responses was examined as part of the data editing and imputation steps. Finally, long-form census questionnaire estimates were compared with other data sources, and certified for final release.
For information about data quality for the census subdivision of Wood Buffalo, the data collection methodology and the use of administrative data sources, please refer to Appendix 1.4 of the Guide to the Census of Population, 2016, Catalogue no. 98-304-X.
The highlights of this mobility and migration data quality assessment are presented below.
Coding
Mobility write-ins for location of residence inside Canada were converted to their 7-digit Standard Geographical Classification (2016). There are two coded write-in fields for location of residence inside Canada, the place name of a respondent's location of residence 1 year or 5 years ago and the postal code associated with their location of residence. Mobility outside Canada write-ins were converted to a 5-digit country code based on the place of birth classification.
As can be seen in Table 1, autocoding match rates for place name for questions 22 and 23 are comparable for 2016 and 2011. The postal code autocoding match rate was higher in 2016 than 2011 for Question 22 (81.3% in 2016 versus 76.5% in 2011). For Question 23, the autocoding match rate was fairly constant (74.1% versus 74.4%). Autocoding match rates for location of residence outside Canada were higher for 2016 than 2011 for questions 22 and 23.
| Mobility question number and write-in field | Mobility autocoding match rate | |
|---|---|---|
| 2016 | 2011 | |
| percentage | ||
| Question 22 – inside Canada – place name | 73.0 | 73.9 |
| Question 22 – inside Canada – postal code | 81.3 | 76.5 |
| Question 22 – outside Canada | 95.5 | 91.9 |
| Question 23 – inside Canada – place name | 77.8 | 77.1 |
| Question 23 – inside Canada – postal code | 74.1 | 74.4 |
| Question 23 – outside Canada | 96.5 | 92.7 |
| Source: Statistics Canada, Census of Population, 2016. | ||
Variability due to sampling and total non-response
The objective of the long-form census questionnaire is to produce estimates on various topics for a wide variety of geographies, ranging from very large areas (such as provinces and census metropolitan areas) to very small areas (such as neighbourhoods and municipalities), and for various subpopulations (such as Aboriginal peoples and immigrants) that are generally referred to as 'domains of interest.' In order to reduce response burden, the long-form census questionnaire is administered to a random sample of households.
This sampling approach and the total non-response introduce variability in the estimates that needs to be accounted for. This variability also depends on the population size and the variability of the characteristics being measured. Furthermore, the precision of estimates may vary appreciably depending on the domain or geography of interest, in particular because of the variation in response rates. For more information on the variability due to sampling and total non-response in long-form census questionnaire estimates, please refer to the Guide to the Census of Population, 2016, Catalogue no. 98-304-X.
Non-response bias
Non-response bias is a potential source of error for all surveys, including the long-form census questionnaire. Non-response bias arises when the characteristics of those who participate in a survey are different from those who do not.
In general, the risk of non-response bias increases as the response rate declines. For the 2016 long-form census questionnaire, Statistics Canada adapted its collection and estimation procedures in order to mitigate, to the extent possible, the effect of non-response bias. For more information on these mitigation strategies, please refer to the Guide to the Census of Population, 2016, Catalogue no. 98-304-X.
Data quality indicators
A number of quality indicators were produced and analysed during the data quality assessment of the long-form census questionnaire. Three of these are presented to users: the global non-response rate (GNR), the standard error, and the imputation rate by question.
The GNR combines non-response at the household level (or total non-response) and non-response at the question level (partial non-response). It is calculated and presented for each geographic area. The GNR is the key criterion that determines whether or not the long-form census questionnaire results are released for a given geographic area – data are suppressed for geographic areas with a GNR equal to or greater than 50%. More information on the GNR is available in the Guide to the Census of Population, 2016, Catalogue no. 98-304-X.
The standard error is a measure of the precision of an estimate with respect to sampling and total non-response variability. A small standard error corresponds to a precise estimate. Standard errors are made available to users for certain long-form census questionnaire estimate, except in cases where confidentiality would be compromised. The standard error can be used to derive other indicators of precision such as the coefficient of variation. It can also be used for most types of population parameters of interest (e.g., a count, a proportion or an average) and, using an adequate methodology, to derive margins of errors or confidence intervals for a given confidence level or to perform statistical inference (hypothesis testing). For more information on the long-form census questionnaire standard error and its interpretability and use, please refer to the Guide to the Census of Population, 2016, Catalogue no. 98-304-X.
The imputation rate by question, excluding global non-response, is a measurement of quality specific to each question in the long-form census questionnaire. It measures the proportion of respondents ('respondents' being defined as those for whom a fully- or partially-completed questionnaire was returned) who did not answer the question, or whose response was invalid and for which a valid value was assigned. Imputation eliminates gaps in the data and, when done appropriately, reduces bias introduced by non-response. This is done by identifying persons or households that have characteristics similar to the incomplete record and by copying their values to fill in the missing or erroneous responses.
Tables 2 to 4 show the weighted imputation rates for the six principal mobility variables.
For mobility status 1 year ago and 5 years ago, imputation rates were lower for 2016 than 2011. The imputation rate for mobility status 1 year ago declined from 4.3% in 2011 to 1.8% in 2016. For mobility status 5 years ago, the imputation rate declined from 5.4% to 2.4% in 2016. A decline was seen in the imputation rate for these variables across all provinces and territories with exception of Northwest Territories and Nunavut.
| Region | Mobility status 1 year ago | Mobility status 5 years ago | ||
|---|---|---|---|---|
| 2016 | 2011 | 2016 | 2011 | |
| percentage | ||||
| Canada | 1.8 | 4.3 | 2.4 | 5.4 |
| Newfoundland and Labrador | 2.8 | 4.0 | 3.0 | 4.3 |
| Prince Edward Island | 2.3 | 4.2 | 2.8 | 5.0 |
| Nova Scotia | 2.5 | 4.2 | 4.1 | 6.0 |
| New Brunswick | 2.0 | 4.1 | 2.3 | 4.7 |
| Quebec | 2.0 | 3.9 | 2.4 | 5.0 |
| Ontario | 1.6 | 4.7 | 2.3 | 6.0 |
| Manitoba | 1.7 | 4.1 | 2.2 | 4.8 |
| Saskatchewan | 1.8 | 3.9 | 2.2 | 4.4 |
| Alberta | 1.7 | 4.4 | 2.3 | 5.3 |
| British Columbia | 1.6 | 4.3 | 2.0 | 5.1 |
| Yukon | 1.4 | 5.1 | 1.9 | 5.4 |
| Northwest Territories | 2.4 | 1.2 | 2.7 | 1.7 |
| Nunavut | 1.9 | 1.7 | 2.3 | 2.4 |
| Sources: Statistics Canada, Census of Population, 2016 and National Household Survey, 2011. | ||||
Table 3 shows the imputation rates for census subdivision (CSD) of residence 1 year and 5 years ago for internal migrants. Between 2016 and 2011, there was a general decline in the imputation rate of these two variables. At the Canada level, the imputation rates declined from 6.9% to 3.6% for CSD of residence 1 year ago and from 7.6% to 3.7% for CSD of residence 5 years ago. With the exception of the Northwest Territories and Nunavut, all provinces and territories show a decline in the imputation rates for these variables.
| Region | CSD of residence 1 year ago | CSD of residence 5 years ago | ||
|---|---|---|---|---|
| 2016 | 2011 | 2016 | 2011 | |
| percentage | ||||
| Canada | 3.6 | 6.9 | 3.7 | 7.6 |
| Newfoundland and Labrador | 4.1 | 6.0 | 4.3 | 7.2 |
| Prince Edward Island | 7.8 | 10.1 | 6.9 | 9.5 |
| Nova Scotia | 5.4 | 7.5 | 5.3 | 9.2 |
| New Brunswick | 3.0 | 6.6 | 3.5 | 7.5 |
| Quebec | 3.2 | 5.9 | 3.2 | 6.3 |
| Ontario | 3.6 | 7.1 | 3.4 | 8.2 |
| Manitoba | 5.0 | 8.0 | 4.6 | 7.7 |
| Saskatchewan | 4.5 | 6.9 | 4.3 | 7.5 |
| Alberta | 4.4 | 7.4 | 4.5 | 8. 7 |
| British Columbia | 3.1 | 6.9 | 3.3 | 7.3 |
| Yukon | 8.0 | 15.0 | 7.3 | 12.1 |
| Northwest Territories | 6.7 | 5.8 | 7.4 | 7.0 |
| Nunavut | 8.0 | 2.5 | 11.2 | 4.4 |
| Sources: Statistics Canada, Census of Population, 2016 and National Household Survey, 2011. | ||||
Table 4 displays the imputation rates for country of residence 1 year and 5 years ago for external migrants. For 2016, country of residence 1 year and 5 years ago showed a decline in imputation rates compared to 2011. The imputation rate for country of residence 1 year ago declined from 5.6% in 2011 to 2.1% in 2016. Similarly, the imputation rate for country of residence 5 years ago declined from 5.9% in 2011 to 1.9% in 2016. A decline was seen in the imputation rates for these variables across all provinces and territories with the exception of the Northwest Territories and Nunavut for both variables and Newfoundland and Labrador for Country of residence 1 year ago.
| Region | Country of residence 1 year ago | Country of residence 5 years ago | ||
|---|---|---|---|---|
| 2016 | 2011 | 2016 | 2011 | |
| percentage | ||||
| Canada | 2.1 | 5.6 | 1.9 | 5.9 |
| Newfoundland and Labrador | 1.6 | 0.9 | 2.6 | 3.9 |
| Prince Edward Island | 2.5 | 18.7 | 1.1 | 12.2 |
| Nova Scotia | 4.0 | 8.0 | 2.6 | 5.4 |
| New Brunswick | 1.2 | 3.8 | 1.5 | 4.5 |
| Quebec | 1.9 | 4.6 | 1.6 | 4.2 |
| Ontario | 1.8 | 6.0 | 1.8 | 6.6 |
| Manitoba | 1.2 | 4.3 | 1.1 | 6.0 |
| Saskatchewan | 1.7 | 5.1 | 1.5 | 7.0 |
| Alberta | 2.0 | 5.8 | 2.0 | 6.2 |
| British Columbia | 3.0 | 5.6 | 2.4 | 5.5 |
| Yukon | 1.2 | 17.7 | 2.7 | 10.3 |
| Northwest Territories | 2.7 | 0.6 | 2.1 | 0.4 |
| Nunavut | 5.8 | 0.0 | 7.0 | 0.7 |
| Sources: Statistics Canada, Census of Population, 2016 and National Household Survey, 2011. | ||||
Certification of final estimates
Once data processing, editing and imputation were completed, the data were weighted in order for estimates to represent the total Canadian population living in private dwellings. Certification of the final weighted estimates was the last step in the validation process leading to recommendation for release of the data for each geography and domain of interest. Based on the analysis of data quality indicators and the comparison of the long-form census questionnaire estimates with other data sources, the recommendation is for unconditional release, conditional release or non-release for quality reasons. In the case of conditional release or non-release, appropriate notes and warnings are included in this guide. Several data sources were used to evaluate the long-form census questionnaire estimates. However, since the risk of error often increases for lower levels of geography and for smaller populations, and the data sources used to evaluate these results are less reliable (or not available) at these lower levels, it can be difficult to certify the estimates at these levels.
Long-form census questionnaire estimates are also subject to confidentiality rules that ensure non-disclosure of individual respondent identity and characteristics. For more information on confidentiality rules, please refer to the Guide to the Census of Population, 2016, Catalogue no. 98-304-X.
For more information on data processing and the calculation of the estimates and their level of precision, please refer to the Sampling and Weighting Technical Report, Census of Population, 2016, Catalogue no. 98-306-X.
Comparability with other data sources
As a standard practice, the quality of the 2016 Census mobility and migration information was evaluated internally prior to publication. The data were compared, to the extent possible, with alternative data sources.
Migration flows created from mobility data, for 1 year and 5 year time periods, were compared with migration estimates derived from Statistics Canada's Population Estimates Program. The Population Estimates Program bases its migration model on T1 tax data and Child Tax Benefits data. Estimates of internal migrants based on the 2016 Census are, in general, lower than the ones derived from administrative data.
Country of residence data for 1 year and 5 years ago were compared with administrative data provided by Immigration, Refugees and Citizenship Canada.
Data quality notes
Estimates of internal migration may be less accurate for small geographic areas, areas with a place name that is a duplicate elsewhere, and for some census subdivisions (CSDs) where residents may have provided the name of the census metropolitan area or census agglomeration instead of the specific name of the component CSD from which they migrated.
- Date modified: