
Housing Reference Guide, Census of Population, 2016
Definitions and concepts
The 2016 Census of Population questions collected information on housing for all private households. Variables pertaining to housing information can be classified into three groups: (1) dwelling characteristics; (2) household characteristics related to shelter costs and (3) other household characteristics.
Dwelling characteristics refer to the physical attributes of the living quarters occupied by the household. The Census of Population collected the following information: number of Rooms; number of Bedrooms; Period of construction; Dwelling condition; Condominium status and Value (owner estimated) of dwelling. Dwelling characteristics, except the value of the dwelling, were collected for all occupied private dwellings. The value of the dwelling was collected only for owner-occupied dwellings that were not located on an agricultural operation that was operated by a member of the household. This exception occurred because households that rent the dwelling have difficulty assessing the value of the dwelling because they were not involved in the purchase. Furthermore, owner-occupied dwellings that are part of an agricultural operation were excluded because often the value of dwelling cannot be separated from the value of the agricultural operation.
Shelter costs refer to the average total of expenses related to the dwelling paid by households. For owner-occupied dwellings, the shelter costs are referred to as Owner's major payments. For renter-occupied dwellings, the shelter costs are referred to as Gross rent. The Census of Population also collected the following information related to shelter costs: whether a rented dwelling was subsidized (see Subsidized housing) and whether the owned dwelling had a mortgage (see Presence of mortgage payments). Shelter costs and the related variables were disseminated for owner-occupied dwellings and renter-occupied dwellings. Shelter costs were not disseminated for band housing, dwellings on reserves and dwellings that are part of an agricultural operation operated by a member of the household. Shelter costs for band housing were not collected because, for historical and statutory reasons, the usual components of shelter cost payments do not always apply. Shelter costs on reserves were not disseminated because a large portion of dwellings on reserves were band housing (for which shelter costs were not collected); thus, shelter costs of only owner-occupied dwellings and renter-occupied dwellings on reserves were not representative of the entire reserve. Shelter costs were not collected for dwellings that are part of an agricultural operation operated by a member of the household because often the shelter costs of the dwelling cannot be separated from the shelter costs of the agricultural operation.
Household characteristics refer to characteristics of the person or group of persons occupying the private dwelling. These are different from the characteristics of persons, in that the household characteristics are generally intended to describe all household members. Household characteristics collected by the Census of Population that are commonly used in housing analysis include: Tenure, Household size, household Total income and Household type. Household characteristics were collected for all private households. The Census of Population also collected information to identify the Household maintainer; that is, which household member paid the shelter costs. A common approach in housing analysis is to examine the characteristics of the Primary household maintainer (such as age) in relation to dwelling, shelter costs and other household characteristics.
Housing adequacy, housing suitability and housing affordability are key household indicators and topics of interest for governments and housing organizations. Variables collected in the Census of Population are combined to create household indicators to help governments and organizations manage the state of housing in Canada.
An indicator for housing adequacy is the condition of the dwelling. An indicator for housing suitability (a topic commonly referred to as crowding) is whether the dwelling has enough bedrooms for the size and composition of the household. Another indicator of crowding is the number of persons per room in a dwelling. An indicator of housing affordability is the proportion of household total income that is spent on shelter costs.
Classifications
Classifications used for indicators of housing adequacy, housing suitability and housing affordability are based on generally-accepted classifications used by governments and housing organizations, like the Canada Mortgage and Housing Corporation (CMHC).
Dwelling condition (an indicator for housing adequacy) is classified into three groups: needing regular maintenance only, needing minor repairs and needing major repairs. Dwellings in need of major repairs are considered an indicator of inadequate dwellings by housing organizations. At the time of the census, to guide respondents in answering the question on the condition of the dwelling, examples were included in each response category. The examples of 'major repair' were intended to capture problems that compromised the dwelling structure or the major systems of the dwelling (heating, plumbing and electrical). Specifically, the questionnaire contained the following examples for 'major repairs': 'defective plumbing or electrical wiring, structural repairs to walls, floors or ceilings, etc.' Examples of 'regular maintenance' and 'minor repair' were also on the questionnaire. For 'minor repairs,' the examples on the questionnaire were: 'missing or loose floor tiles, bricks or shingles, defective steps, railing or siding, etc.' For 'regular maintenance,' the examples on the questionnaire were: 'painting, furnace cleaning, etc.'
Housing suitability of a dwelling is based on the National Occupancy Standard (NOS) developed by CMHC. The housing suitability indicator classifies dwellings as 'not suitable' if the dwelling does not have enough bedrooms for the size and composition of the household, as calculated using NOS. Dwellings that are not suitable are also further classified by the shortfall of the number of bedrooms when compared to the required number of bedrooms based on NOS.
Persons per room is a measure of crowding that considers all rooms in a private dwelling and the number of members of the household. A higher value of persons per room indicates a higher level of crowding. Generally, housing research in Canada uses a threshold of more than one person per room to determine that a dwelling in Canada is crowded. The United Nations considers densities of three or more persons per room to be overcrowded under any circumstance but states that this level may be raised or lowered for national use.
The Shelter-cost-to-income ratio (an indicator for housing affordability) is classified into several ranges, as shown in the data tables. The classification related to housing affordability is whether the occupants of the dwelling paid 30% or more of household total income towards shelter costs. In 1986, CMHC and the provinces agreed to use the 30% threshold to measure affordability for the purposes of defining need for social housing. This agreement was reached during the development of the federal/provincial social housing programs. Research on housing affordability in the territories often uses the same threshold.
Classifications for housing variables are shown in the Dictionary, Census of Population, 2016, Catalogue no. 98-301-X.
Questions
Most 2016 long-form Census of Population respondents received the Form 2A-L questionnaire, while respondents living on Indian reserves, in Indian settlements, in Inuit regions and in other remote areas received the Form 2A-R questionnaire. On both questionnaires, data on housing was collected in STEP F. The first page of housing questions (F1 to F6) collected household and dwelling characteristics applicable to all private households, regardless of housing tenure. The second page of housing questions (F7 to F10) collected shelter costs information. Skip patterns on the shelter costs questions are based on housing tenure, as the components of shelter costs vary on this characteristic.
The main difference between the housing questions on the 2A-L and 2A-R forms was that the 2A-R questionnaire allowed for housing tenure responses of 'band housing' and the skip patterns for shelter costs questions were different to account for 'band housing' responses. Also, the examples presented in the question on the number of rooms and bedrooms were different on the 2A-R form so that the examples would be relevant for northern areas. Otherwise, the housing questions were identical.
Note: Information on the historical comparability of the 2016 Census of Population questions and those asked in earlier censuses is provided in the 'Comparability of concepts over time' section of this document.
Data quality
The 2016 long-form census questionnaire underwent a thorough data quality assessment, similar to what was done for the 2011 National Household Survey (NHS) and past censuses. A number of data quality indicators (briefly described below) were produced and used to evaluate the quality of the data.
The data quality assessment was done in addition to the regular quality checks completed at key stages of the survey. For example, during data collection and processing, the consistency of the responses provided was checked and the non-response rates for each question were analysed. As well, the quality of imputed responses was examined as part of the data editing and imputation steps. Finally, long-form census questionnaire estimates were compared with other sources and certified for final release.
For information about data quality for the census subdivision of Wood Buffalo, the data collection methodology and the use of administrative data sources, please refer to Appendix 1.4 of the Guide to the Census of Population, 2016, Catalogue no. 98-304-X.
The main highlights of this assessment for the housing data are presented below.
Variability due to sampling and total non-response
The objective of the long-form census questionnaire is to produce estimates on various topics for a wide variety of geographies, ranging from very large areas (such as provinces and census metropolitan areas) to very small areas (such as neighbourhoods and municipalities), and for various subpopulations (such as Aboriginal peoples and immigrants) that are generally referred to in this document as 'domains of interest.' In order to reduce response burden, the long-form census questionnaire is administered to a random sample of households.
This sampling approach, and the subsequent total non-response, introduce variability in the estimates that needs to be accounted for. This variability also depends on the population size and the variability of the characteristics being measured. Furthermore, the precision of estimates may vary appreciably depending on the domain or geography of interest, in particular because of the variation in response rates. For more information on the variability due to sampling and total non-response in long-form census questionnaire estimates, please refer to the Guide to the Census of Population, 2016, Catalogue no. 98-304-X.
Non-response bias
Non-response bias is a potential source of error for all surveys, including the long-form census questionnaire. Non-response bias arises when the characteristics of those who participate in a survey are different from those who do not.
In general, the risk of non-response bias increases as the response rate declines. For the 2016 long-form census questionnaire, Statistics Canada adapted its collection and estimation procedures in order to mitigate, to the extent possible, the effect of non-response bias. For more information on these mitigation strategies, please refer to the Guide to the Census of Population, 2016, Catalogue no. 98-304-X.
Data quality indicators
A number of quality indicators were produced and analysed during the data quality assessment of the long-form census questionnaire. Three of these are presented to users: the global non-response rate (GNR), the standard error and the imputation rate by question.
The GNR combines non-response at the household level (or total non-response) and non-response at the question level (partial non-response). It is calculated and presented for each geographic area. The GNR is the key criterion that determines whether or not the long-form census questionnaire results are released for a given geographic area; data are suppressed for geographic areas with a GNR equal to or greater than 50%. More information on the GNR is available in the Guide to the Census of Population, 2016, Catalogue no. 98-304-X.
The standard error is a measure of the precision of an estimate with respect to sampling and total non-response variability. A small standard error corresponds to a precise estimate. Standard errors are made available to users for certain long-form census questionnaire estimates, except in cases where confidentiality would be compromised. The standard error can be used to derive other indicators of precision such as the coefficient of variation. It can also be used for most types of population parameters of interest (e.g., a count, a proportion or an average) and, using an adequate methodology, to derive margins of errors or confidence intervals for a given confidence level or to perform statistical inference (hypothesis testing). For more information on the long-form census questionnaire standard error and its interpretability and use, please refer to the Guide to the Census of Population, 2016, Catalogue no. 98-304-X.
The imputation rate by question, excluding global non-response, is a measurement of quality specific to each question in the long-form census questionnaire. It measures the proportion of respondents ('respondents' being defined as those for whom a fully- or partially-completed questionnaire was returned) who did not answer the question, or whose response was invalid and for which a valid value was assigned. Imputation eliminates gaps in the data and, when done appropriately, reduces bias introduced by non-response. This is done by identifying persons or households that have characteristics similar to the incomplete record and by copying their values to fill in the missing or erroneous responses. The imputation rates by question are presented below.
Certification of final estimates
Once data processing, editing and imputation were completed, the data were weighted in order for estimates to represent the total Canadian population living in private dwellings. Certification of the final weighted estimates was the last step in the validation process leading to recommendation for release of the data for each geography and domain of interest. Based on the analysis of data quality indicators and the comparison of the long-form census questionnaire estimates with other data sources, the recommendation is for unconditional release, conditional release or non-release for quality reasons. In the case of conditional release or non-release, appropriate notes and warnings are included in this guide. Several data sources were used to evaluate the long-form census questionnaire estimates. However, since the risk of error often increases for lower levels of geography and for smaller populations because of the variability due to sampling and total non-response, and the data sources used to evaluate these results are less reliable (or not available) at these lower levels, it can be difficult to certify the estimates at these levels.
Long-form census questionnaire estimates are also subject to confidentiality rules that ensure non-disclosure of individual respondent identity and characteristics. For more information on census data confidentiality rules, please refer to the Guide to the Census of Population, 2016, Catalogue no. 98-304-X.
For more information on data processing and the calculation of the estimates and their level of precision, please refer to the Sampling and Weighting Technical Report, Census of Population, 2016, Catalogue no. 98-306-X.
Data quality assessment
The overall quality of the housing variables from the Census of Population 2016, is recommended for unconditional release. Considerable effort is made throughout the entire process to ensure high standards of data quality; however the resulting data might be subject to a certain degree of inaccuracy. The evaluation of the housing variables consisted of the following:
- examination of the imputation rates for the housing variables
- historical comparison with data from the previous census(es)
- comparison with other sources of data as applicable.
To assess the appropriateness of the Census of Population 2016 data for users' purposes, and to understand the risk involved in drawing conclusions or making decisions on the basis of these data, users should be aware of the following data quality indicators for the housing variables.
Question-level imputation rates
Even though a household returns a questionnaire, some questions may not have been answered or may have had an invalid response. These records undergo imputation to estimate a valid value for the question. Table 1 contains the imputation rates for the housing questions. At the national level, these rates are substantially lower when compared to the 2011 NHS housing questions imputation rates, which can be partly attributed to differences in survey methodology. The 2016 Census question-level imputation rates for the Northwest Territories and Nunavut were relatively closer to the 2011 NHS housing questions imputation rates, which is likely due to the canvasser and list/leave collection methods used in many areas of these region. Imputation rates from the 2011 NHS can be found in the Housing Reference Guide, National Household Survey, 2011.
| Question no. | Variable | Can. | N.L. | P.E.I. | N.S. | N.B. | Que. | Ont. | Man. | Sask. | Alta. | B.C. | Y.T. | N.W.T. | Nvt. |
|---|---|---|---|---|---|---|---|---|---|---|---|---|---|---|---|
| percentage | |||||||||||||||
| F1 | Household maintainerTable 1 Note 1 | 2.0 | 3.0 | 2.0 | 2.0 | 1.9 | 1.5 | 1.9 | 2.5 | 2.8 | 2.4 | 2.3 | 1.9 | 2.3 | 5.0 |
| F2 | TenureTable 1 Note 2 | 1.8 | 2.7 | 2.4 | 1.9 | 1.9 | 2.1 | 1.6 | 2.0 | 2.1 | 1.8 | 1.7 | 2.8 | 2.9 | 5.6 |
| F3 | Condominium StatusTable 1 Note 2 | 1.3 | 2.3 | 2.2 | 1.5 | 1.7 | 1.4 | 1.1 | 1.4 | 1.6 | 1.6 | 1.3 | 1.6 | 2.7 | 8.0 |
| F4(a) | RoomsTable 1 Note 2 | 3.6 | 4.6 | 3.6 | 3.1 | 3.2 | 2.8 | 3.5 | 3.3 | 3.6 | 4.0 | 5.3 | 5.3 | 5.5 | 4.2 |
| F4(b) | BedroomsTable 1 Note 2 | 1.8 | 2.3 | 2.1 | 1.7 | 1.8 | 1.7 | 1.7 | 1.7 | 2.0 | 2.0 | 2.0 | 1.7 | 2.3 | 2.9 |
| F5 | Period of constructionTable 1 Note 2 | 2.9 | 3.5 | 3.6 | 2.8 | 2.8 | 3.3 | 2.7 | 3.0 | 2.8 | 2.9 | 2.4 | 2.6 | 4.8 | 11.3 |
| F6 | Condition of dwellingTable 1 Note 2 | 1.7 | 2.3 | 2.3 | 1.6 | 1.8 | 1.9 | 1.5 | 1.5 | 1.7 | 1.7 | 1.6 | 1.4 | 1.9 | 2.8 |
| F8(a) | Electricity paymentTable 1 Note 3 | 6.8 | 9.0 | 8.5 | 7.5 | 7.0 | 6.0 | 6.8 | 7.8 | 8.6 | 7.3 | 6.7 | 6.9 | 5.9 | 9.2 |
| F8(b) | Fuel paymentTable 1 Note 3 | 7.0 | 11.8 | 9.6 | 8.1 | 7.7 | 6.7 | 6.7 | 8.4 | 8.6 | 7.3 | 6.6 | 6.9 | 7.6 | 9.2 |
| F8(c) | Water, other service paymentTable 1 Note 3 | 7.0 | 10.5 | 9.8 | 7.7 | 7.3 | 7.3 | 6.5 | 7.4 | 8.2 | 7.0 | 6.5 | 6.5 | 5.8 | 8.5 |
| F9(a) | RentTable 1 Note 4 | 5.4 | 8.1 | 8.3 | 6.6 | 6.6 | 4.7 | 5.7 | 6.1 | 6.8 | 5.4 | 5.2 | 7.6 | 4.9 | 5.0 |
| F9(b) | Subsidy statusTable 1 Note 4 | 5.1 | 7.2 | 8.5 | 6.2 | 6.3 | 4.3 | 5.2 | 6.1 | 7.1 | 5.6 | 5.2 | 6.5 | 4.8 | 5.2 |
| F10(a) | Mortgage paymentTable 1 Note 5 | 5.1 | 8.0 | 7.7 | 6.0 | 5.7 | 4.7 | 4.6 | 5.7 | 7.2 | 5.5 | 5.0 | 5.5 | 5.0 | 10.0 |
| F10(b) | Property taxes included in mortgageTable 1 Note 5,Table 1 Note 6 | 4.1 | 6.5 | 6.3 | 4.8 | 4.4 | 3.8 | 3.8 | 4.5 | 5.7 | 4.6 | 4.2 | 4.9 | 5.8 | 11.9 |
| F10(c) | Property taxesTable 1 Note 5,Table 1 Note 7 | 7.4 | 25.6 | 10.2 | 8.8 | 9.0 | 7.2 | 6.3 | 7.5 | 9.4 | 7.2 | 7.2 | 11.6 | 27.5 | 31.2 |
| F10(d) | Value of dwellingTable 1 Note 5 | 7.1 | 12.1 | 10.8 | 8.8 | 8.2 | 7.1 | 6.3 | 7.6 | 9.5 | 7.2 | 7.2 | 9.0 | 10.9 | 16.8 |
| F10(e) | Condominium feeTable 1 Note 5,Table 1 Note 8 | 14.4 | 24.2 | 33.4 | 14.1 | 27.2 | 14.6 | 14.4 | 12.3 | 10.8 | 10.7 | 16.4 | 20.0 | 11.1 | 28.7 |
Source: Statistics Canada, Census of Population, 2016. |
|||||||||||||||
Comparability of concepts over time
Most of the housing information in the Census of Population was collected in previous long-form censuses and the 2011 National Household Survey (NHS). Over time, there have been differences in question wording, format, examples and instructions given to enumerators and respondents. The historical comparability of some components of the housing data has been affected by these factors.
Although the Census of Population housing questions were essentially the same as the 2011 NHS housing questions and the 2006 long-form questionnaire, there were some differences. The differences include:
2011 National Household Survey
The questions on how many rooms/bedrooms there are in a dwelling had a change in wording to the instructions. The 2011 NHS English version used the word 'include' to identify the types of rooms/bedrooms to be accounted for in the total number. In the English version of the 2016 Census of Population, the word 'count' was used instead, to more clearly identify specific types to be included in the total number. The French wording did not change from 2011 to 2016; 'Comptez' was used both years.
Figure 1
Rooms and bedrooms questions, Census of Population, 2016
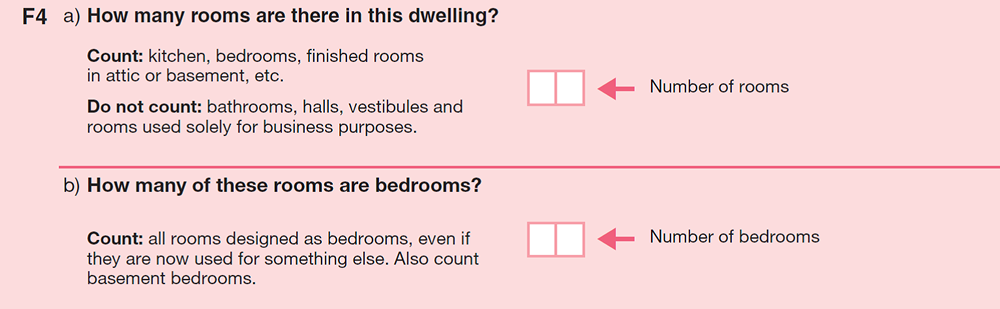
Description for Figure 1
The title of this figure is "Rooms and bedrooms questions, Census of Population, 2016."
This figure is a screenshot of the paper questionnaire (PQ) containing questions F4 a) and F4 b).
Question F4 a) asks, "How many rooms are there in this dwelling?
Count: kitchen, bedrooms, finished rooms in attic or basement, etc.
Do not count: bathrooms, halls, vestibules and rooms used solely for business purposes."
On the right side of the question, there are two edit fields to fill in the "Number of rooms."
Question F4 b) asks, "How many of these rooms are bedrooms?
Count: all rooms designed as bedrooms, even if they are now used for something else. Also count basement bedrooms."
On the right side of the question, there are two edit fields to fill in the "Number of bedrooms."
Figure 2
Rooms and bedrooms questions, National Household Survey, 2011
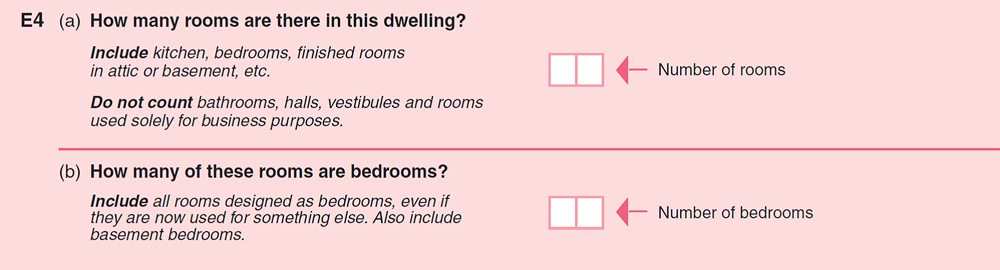
Description for Figure 2
The title of this figure is "Rooms and bedrooms questions, National Household Survey, 2011."
This figure is a screenshot of the paper questionnaire (PQ) containing questions E4 (a) and E4 (b).
Question E4 (a) asks, "How many rooms are there in this dwelling?
Include kitchen, bedrooms, finished rooms in attic or basement, etc.
Do not count bathrooms, halls, vestibules and rooms used solely for business purposes."
On the right side of the question, there are two edit fields to fill in the "Number of rooms."
Question E4 (b) asks, "How many of these rooms are bedrooms?
Include all rooms designed as bedrooms, even if they are now used for something else. Also include basement bedrooms."
On the right side of the question, there are two edit fields to fill in the "Number of bedrooms."
2006 Census of population
- The 2016 Census of Population collected condominium status for all private households to have better coverage of the condominium housing stock—specifically condominium units that were renter occupied. This procedure was the same for the 2011 National Household Survey (NHS), however, the question asking whether the dwelling was part of a condominium development was asked only to owner-households in the 2006 Census.
- The question on whether the dwelling was a residence on an agricultural operation was a 'Yes/No' question in the 2016 Census of Population and the 2011 NHS. In the 2006 Census, it was a note on the questionnaire and respondents only marked a check circle if they were a farm operator in a residence on the agricultural operation. Qualitative testing showed that respondents often missed the note in the 2006 Census; thus, the 2016 Census and 2011 NHS versions of the question were redesigned to address this issue.
- The 2016 Census and 2011 NHS both had a question to identify tenant households living in subsidized dwellings. The 2006 Census had no questions on housing subsidies.
In addition to differences in the above question wording between the 2016 Census of Population, 2011 NHS and the 2006 Census of Population, the survey methodology of these data sources was different, which could affect comparability. For additional information on the general comparison of census data with NHS data, please see the Guide to the Census of Population, 2016, Catalogue no. 98-304-X, and reference materials from previous cycles.
Comparability with other data sources
Statistics Canada produces a range of housing data from various sources for different uses. Comparability of housing data across data sources is affected by differences in survey target populations or administrative sources, survey sampling and collection methodologies; survey objectives, question wording, format, examples and instructions; approaches to data processing; the social and political climate at the time of data collection; and other factors.
As with every survey, the quality of the Census of Population housing information released was evaluated internally prior to publication. The data were compared, as much as possible, with alternative data sources. The main sources of comparison were the Canadian Income Survey (CIS), and the Survey of Household Spending (SHS).
2015 Canadian Income Survey (CIS) and 2015 Survey of Household Spending (SHS)
Like the census, the CIS and SHS also include questions on housing. Generally, the statistics are comparable between these two surveys and the census, taking into account sampling variability. However, differences in question wording, question order, collection method, target population, and reference period (resulting from different collection time within the year), means that the results are not expected to be identical. Furthermore, where differences were observed, comparisons of the SHS and the Survey of Labour and Income Dynamics (SLID) to the 2011 NHS also showed similar differences (in both magnitude and direction)—which suggest methodological differences that have been present throughout the years. The SLID program was discontinued in 2011 and replaced by the CIS which produces data from 2012 onward. For this reason, the Census of Population 2016 comparisons are made using the CIS. The table below contains select housing statistics at the national level for each of the surveys.
CIS and SHS also collect data on the condominium status of the dwelling. However, estimates of the proportion of condominiums based on these surveys have high sampling variability. Furthermore, the CIS captures the condominium status for owner-occupied dwellings only, while the SHS captures it for owner-occupied and tenant-occupied condominiums.
The Census and CIS rates for subsidized rental housing are comparable, however, the SHS rate is lower due to more narrow criteria of inclusion for types of subsidized housing.
| Selected Statistics | 2016 Census of Population | 2016 Census of Population, adjustedTable 2 Note 1 | 2015 Survey of Household SpendingTable 2 Note 1 | 2015 Canadian Income SurveyTable 2 Note 1 |
|---|---|---|---|---|
| Number of private households in Canada | 14,072,079 | 13,935,239 | 14,097,438Table 2 Note 2 | 14,186,000Table 2 Note 2 |
| Percentage of owner households | 67.8% | 68.1% | 67.0% | 67.6% |
| Percentage of dwellings requiring major repair | 6.5% | 6.3% | 8.5% | 6.6% |
| Average owner’s major payments ($/month) | $1,309 | $1,311 | $1,223 | $1,318 |
| Average net rent ($/month) | $904 | $905 | $929 | $940 |
| Percentage of owner households that paid 30% or more of household total income towards shelter costs | 18.2% | 16.6% | Note ...: not applicable | 16.8% |
| Percentage of tenant households that paid 30% or more of household total income towards shelter costs | 40.4% | 40.1% | Note ...: not applicable | 41.8% |
| Condominium status | 13.5% | 13.4% | 11.1% | 11.9%Table 2 Note 3 |
| SubsidyTable 2 Note 4 | 13.0% | 12.8% | 8.4% | 11.7% |
... not applicable
|
||||
2016 Multiple Listing Service (MLS®) residential sales data
The average value of dwelling reported by households that own their dwelling was similar but not directly comparable to the average residential prices of MLS®. The estimate from the Census of Population is based on all owner-occupied dwellings and reflects the dollar amount expected by respondent if the dwellings were to be sold on the reference day, May 10, 2016. The figure from MLS® reflects the average dollar amount for all residential sales for the year, 2016. The 2016 Census, based on about 9.5 million owner households in Canada, estimates the average amount households expect to receive if their dwellings were sold was about $443,058. For 2016, MLS® data had an average residential sale price of $489,914—based on 535,264 residential sales across Canada. The gap between the 2011 MLS® average residential sale price ($363,116) and the 2011 NHS estimate ($345,000) was similar to the gap between these two sources in 2016.
Notes
The Guide to the Census of Population, 2016, Catalogue no. 98-304-X, describes the data quality assessments that all variables underwent. Generally, the numerous indicators used to evaluate the quality of the housing data supported the reliability of the data at the national, provincial and territorial levels, but also identified the following items.
Question F2 Housing tenure
Comparison of the homeownership rate in Newfoundland to that from the 2015 Canadian Income Survey (CIS) showed that the 2016 Census rate was higher with a statistical significance (76.7% for the 2016 Census versus 71.2% for CIS). In Manitoba, the homeownership rate for the 2016 Census was lower than the 2015 CIS with a statistical significance (68.7% for the 2016 Census versus 71.3% for the CIS). The rate for the other provinces were not statistically different (note: CIS does not cover the territories).
Question F3 Condominium status
The national condominium ownership rate for the 2016 Census, at 13.2%, was significantly higher than the CIS rate of 11.9%. The condominium ownership rate for the other provinces was not different with a statistical significance, with the exception of the Maritime Provinces where a comparison could not be made due to CIS data suppression.
Question F4 Number of rooms and bedrooms
In dwellings where the number of rooms and bedrooms was small, most often in dwellings with one- or two-rooms, a large proportion was affected by respondent reporting errors. The respondent reporting errors appeared in the form of inconsistencies between two questions: the number of rooms and the number of bedrooms (such as the number of rooms being equal to the number of bedrooms, which implies there were only bedrooms in the dwelling). Respondent errors could occur for any number of reasons, such as forgetting to include bedrooms in the count of rooms or erroneously counting some rooms as bedrooms. These errors were resolved during data processing using rules that ultimately chose one of the two conflicting variables and then imputed the other variable. For one-room dwellings, the level of inconsistencies between the number of rooms and bedrooms prior to processing was about 62% of responses, 9% for two-room dwellings. These rates are lower than the levels observed for the 2011 NHS which were 80% of inconsistent responses for one-room dwellings, and 20% of inconsistent responses for two-room dwellings. The reduction in inconsistencies may be attributed to the change in wording of the instructions in the English version of the 2016 Census questionnaire for rooms and bedrooms. In the past, the respondent was asked to 'include' the rooms/bedrooms based on instructions provided. In 2016, the respondent is asked to 'count' the rooms/bedrooms instead. Households which reported their dwellings had more than one or two rooms or bedrooms were not significantly impacted by the data processing edits, which was also the case in 2011.
Question F5 Period of construction
Building permits provide a good indication of period of construction, however, only account for growth in dwellings. These permits do not account for the demolition of dwellings to make way for the new builds. Building permits are representative of the total dwelling stock whereas the census period of construction concept is specific to occupied private dwellings. For these reasons, Building Permits Survey and census housing data are not always expected to be exactly coherent. The number of households in dwellings built in the periods of 1991 to 1995 and 1996 to 2000 were higher than those from the Building Permits Survey, even when combining them into one 10-year period. This may be due to the recall issues on the part of respondents for older building periods. The number of dwellings built between 2001 and 2005 was lower than the number of building permits issued during that period. When this is combined with the number from 2006 to 2010, the difference for the 10-year period drops substantially. For the most recent period of construction, 2011 to 2016, the numbers for both, census and the Building Permits Survey, are in line when accounting for the time between the issuance of a building permit and the actual construction.
A correlation is expected between the number of dwellings built in a specific period reported by the census and the number of building permits reported by the Building Permits Survey. After accounting for the differences in the target population, coverage and limitations in comparability of the Building Permits Survey, the data for the two sources were relatively consistent overall where data was available.
Question F6 Condition of dwelling
In most provinces, the proportion of households that required major repairs estimated by the Census of Population was similar with 2015 CIS estimates. A comparison of the two surveys did not show statistically significant differences at the provincial and territorial levels of geography with the exception of three provinces. The 2016 Census estimate was higher with a statistical significance for Newfoundland (6.5% for census versus 5.0% for CIS), Manitoba (9.0% for census versus 7.1% for CIS) and Saskatchewan (8.7% for census versus 5.8% for CIS).
Question F9 b) Dwelling Subsidy
When comparing the 2016 Census to 2015 CIS, it was observed that the proportion of renters living in subsidized housing is higher for the census, with a statistical significance for all provinces. The range of differences covers a high of 15.5 percentage points for Newfoundland to a low of 3.6 percentage points for Quebec. Prince Edward Island was not included in the comparison due to suppression of the CIS data.
Cross-classification of housing variables
Housing variables are often crossed with other variables in a table to analyse a subject in more depth. Data users should be aware when examining small populations, either by selecting small geographical areas or by crossing multiple variables, that the estimates will tend to have greater variability due to sampling error and any non-sampling error might have larger impacts.
Further references related to data quality
For general information on the overall content, collection, design, processing and data quality for the Census of Population, please refer to the Guide to the Census of Population, 2016, Catalogue no. 98-304-X.
- Date modified: