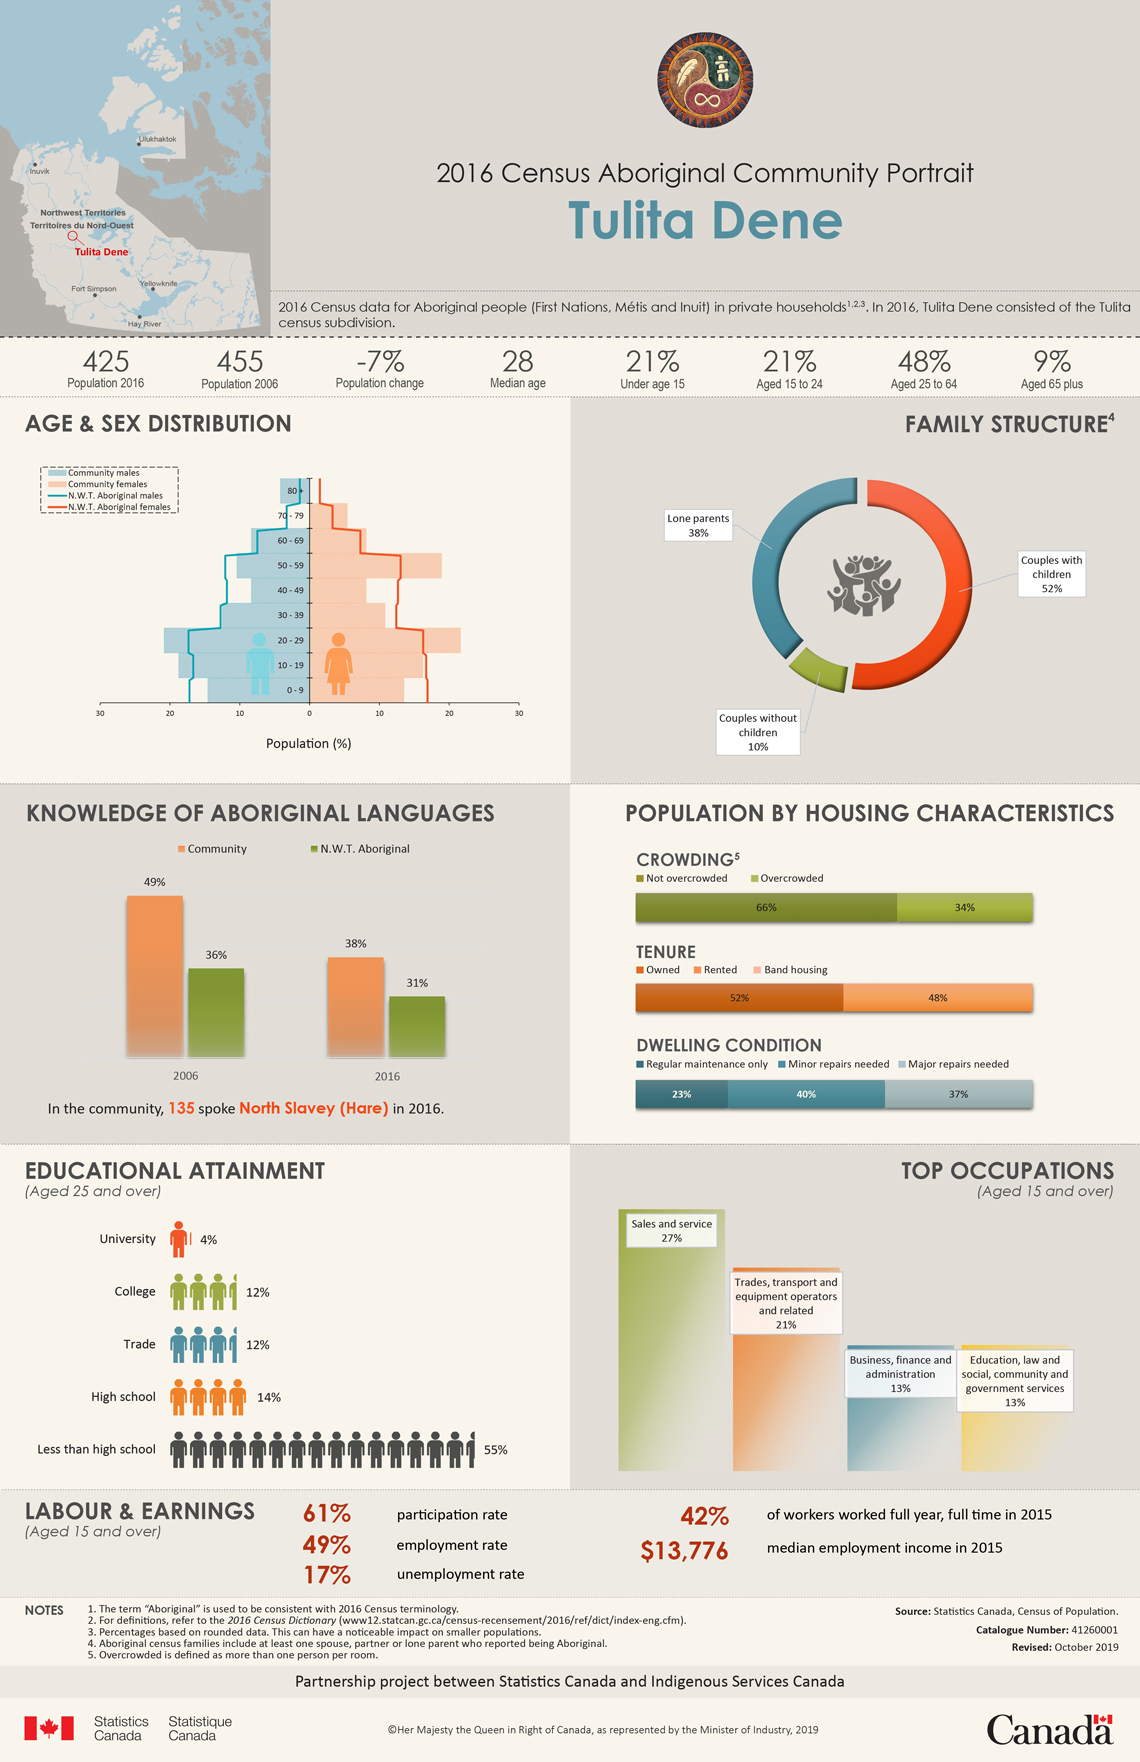
2016 Census Aboriginal Community Portrait — Tulita Dene
2016 Census data for Aboriginal people (First Nations, Métis and Inuit) in private householdsNote 1,Note 2,Note 3
. In 2016, Tulita Dene consisted of the Tulita census subdivision.
Highlights
| Characteristic |
Value |
| Population 2016 |
425 |
| Population 2006 |
455 |
| Population change (%) |
-7 |
| Median age |
28 |
| Under age 15 (%) |
21 |
| Aged 15 to 24 (%) |
21 |
| Aged 25 to 64 (%) |
48 |
| Aged 65 plus (%) |
9 |
Age and sex distribution
| Characteristic |
Value (%) |
| Community males, 0 to 9 years |
15 |
| Community males, 10 to 19 years |
19 |
| Community males, 20 to 29 years |
21 |
| Community males, 30 to 39 years |
13 |
| Community males, 40 to 49 years |
8 |
| Community males, 50 to 59 years |
10 |
| Community males, 60 to 69 years |
8 |
| Community males, 70 to 79 years |
0 |
| Community males, 80 years and over |
4 |
| Community females, 0 to 9 years |
14 |
| Community females, 10 to 19 years |
16 |
| Community females, 20 to 29 years |
22 |
| Community females, 30 to 39 years |
11 |
| Community females, 40 to 49 years |
8 |
| Community females, 50 to 59 years |
19 |
| Community females, 60 to 69 years |
8 |
| Community females, 70 to 79 years |
5 |
| Community females, 80 years and over |
0 |
| Northwest Territories Aboriginal males, 0 to 9 years |
25 |
| Northwest Territories Aboriginal males, 10 to 19 years |
20 |
| Northwest Territories Aboriginal males, 20 to 29 years |
18 |
| Northwest Territories Aboriginal males, 30 to 39 years |
12 |
| Northwest Territories Aboriginal males, 40 to 49 years |
10 |
| Northwest Territories Aboriginal males, 50 to 59 years |
8 |
| Northwest Territories Aboriginal males, 60 to 69 years |
4 |
| Northwest Territories Aboriginal males, 70 to 79 years |
2 |
| Northwest Territories Aboriginal males, 80 years and over |
0 |
| Northwest Territories Aboriginal females, 0 to 9 years |
24 |
| Northwest Territories Aboriginal females, 10 to 19 years |
20 |
| Northwest Territories Aboriginal females, 20 to 29 years |
18 |
| Northwest Territories Aboriginal females, 30 to 39 years |
13 |
| Northwest Territories Aboriginal females, 40 to 49 years |
11 |
| Northwest Territories Aboriginal females, 50 to 59 years |
8 |
| Northwest Territories Aboriginal females, 60 to 69 years |
4 |
| Northwest Territories Aboriginal females, 70 to 79 years |
2 |
| Northwest Territories Aboriginal females, 80 years and over |
1 |
Family structureNote 4
| Characteristic |
Value (%) |
| Couples with children |
52 |
| Couples without children |
10 |
| Lone parents |
38 |
Knowledge of Aboriginal languages
| Characteristic |
Value (%) |
| Community: Knowledge of Aboriginal languages, 2006 |
49 |
| Community: Knowledge of Aboriginal languages, 2016 |
38 |
| Northwest Territories Aboriginal: Knowledge of Aboriginal languages, 2006 |
36 |
| Northwest Territories Aboriginal: Knowledge of Aboriginal languages, 2016 |
31 |
In the community, 135 spoke North Slavey (Hare) in 2016.
Population by housing characteristics: CrowdingNote 5
| Characteristic |
Value (%) |
| Not overcrowded |
66 |
| Overcrowded |
34 |
Population by housing characteristics: Tenure
| Characteristic |
Value (%) |
| Owned |
52 |
| Rented |
48 |
| Band housing |
0 |
Population by housing characteristics: Dwelling condition
| Characteristic |
Value (%) |
| Regular maintenance only |
23 |
| Minor repairs needed |
40 |
| Major repairs needed |
37 |
Educational attainment (Aged 25 and over)
| Characteristic |
Value (%) |
| University |
4 |
| College |
12 |
| Trade |
12 |
| High school |
14 |
| Less than high school |
55 |
Top occupations (Aged 15 and over)
| Occupation |
Value (%) |
| Sales and service
|
27 |
| Trades, transport and equipment operators and related |
21 |
| Business, finance and administration |
13 |
| Education, law and social, community and government services |
13 |
Labour and earnings (Aged 15 and over)
| Characteristic |
Value |
| Participation rate (%) |
61 |
| Employment rate (%) |
49 |
| Unemployment rate (%) |
17 |
| % of workers worked full year, full time in 2015 |
42 |
| Median employment income in 2015 ($) |
13,776 |
Source: Statistics Canada, Census of Population.
Catalogue Number: 41260001
Revised: October 2019
Partnership project between Statistics Canada and Indigenous Services Canada.
© Her Majesty the Queen in Right of Canada, as represented by the Minister of Industry, 2019