
Census in Brief
Children with an immigrant background: Bridging cultures
Release date: October 25, 2017
Highlights
- In 2016, close to 2.2 million children under the age of 15, or 37.5% of the total population of children, had at least one foreign‑born parent.
- Children with an immigrant background could represent between 39% and 49% of the total population of children in 2036.
- Almost half of children with an immigrant background were from an Asian country of ancestry, while less than one‑quarter were from a European country of ancestry or the United States.
- Close to 15% of children with an immigrant background lived in a household with at least three generations.
- More than one‑third of children with an immigrant background spoke only an official language at home, compared with less than 10% of their parents.
Introduction
The growth of the immigrant population and changes in source countries of immigration over the decades have led to greater diversification of the Canadian population’s ethnocultural characteristics. This diversity is increasingly evident in our daycare centres and schools, where Canadian children of all backgrounds mix.
In some ways, children with an immigrant background help build bridges between adult immigrants who have settled in Canada and the rest of the population. On the one hand, these children, who were born in Canada or immigrated to the country at a young age, learn the values, social norms and official languages of their host country through their school, friends and neighbourhood. On the other, they are familiar with the values and specific cultural practices of their parents’ country of origin, not only through their family and cultural community, but also through their own experience in their country of origin.
Therefore, with a dual cultural background, these children grow up, continue studying and eventually join the Canadian labour market.
This release presents some individual, household and linguistic characteristics of this population. These characteristics illustrate the diversity of the population of children, how they are exposed to their parents’ heritage, and how they adopt the cultural elements of their immediate environment outside the family.
Children with an immigrant background: Yesterday, today and tomorrow
In 2016, close to 2.2 million children under the age of 15 living in private households were foreign‑born (first generation) or had at least one foreign‑born parent (second generation). This corresponds to 37.5% of the total population of Canadian children. In 2011, this proportion was 34.6%.
In 1891, the very first year in which questions on parental place of birth were asked in the census, the population of children with an immigrant background was 466,000. This population represented 26.6% of all children under the age of 15 at the time, or 11 percentage points lower than today.
If current immigration trends continue, the number of children with an immigrant background could increase in the coming years. This population could represent between 39.3% and 49.1% of the entire population of children aged 15 and under living in Canada in 2036.Note 1
However, it is the population of children born in Canada to two foreign‑born parents that would likely see the most significant increase. According to Statistics Canada’s reference scenario projections, this population could be between 1.3 million and 2.0 million children in 2036.
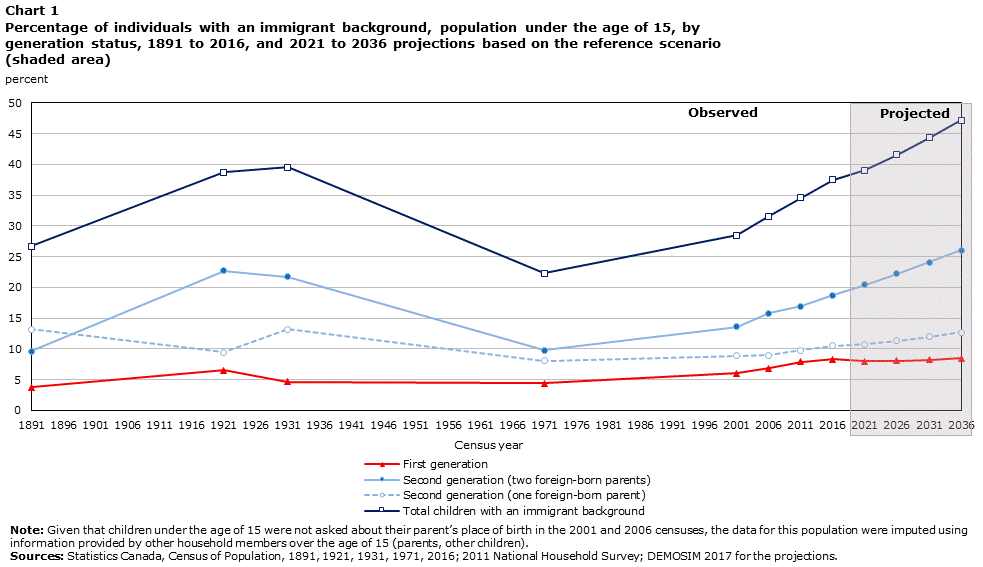
Data table for Chart 1
| Census year | 1891 | 1921 | 1931 | 1971 | 2001 | 2006 | 2011 | 2016 | 2021 | 2026 | 2031 | 2036 |
|---|---|---|---|---|---|---|---|---|---|---|---|---|
| percent | ||||||||||||
| First generation | 3.8 | 6.5 | 4.6 | 4.4 | 6.0 | 6.8 | 7.9 | 8.3 | 8.0 | 8.0 | 8.2 | 8.4 |
| Second generation (two foreign-born parents) | 9.6 | 22.7 | 21.8 | 9.8 | 13.6 | 15.8 | 16.9 | 18.7 | 20.4 | 22.2 | 24.1 | 26.0 |
| Second generation (one foreign-born parent) | 13.2 | 9.5 | 13.2 | 8.0 | 8.9 | 8.9 | 9.8 | 10.5 | 10.7 | 11.3 | 12.0 | 12.7 |
| Total children with an immigrant background | 26.6 | 38.7 | 39.6 | 22.3 | 28.5 | 31.6 | 34.6 | 37.5 | 39.1 | 41.5 | 44.3 | 47.2 |
|
Note: Given that children under the age of 15 were not asked about their parent’s place of birth in the 2001 and 2006 censuses, the data for this population were imputed using information provided by other household members over the age of 15 (parents, other children). Source: Statistics Canada, Census of Population, 1891, 1921, 1931, 1971, 2016; 2011 National Household Survey; DEMOSIM 2017 for the projections. |
||||||||||||
Almost 3 in 10 children in Canada are second generation
The majority of immigrants arrive in Canada in their early adult years and generally have children once they have settled.
However, the population of children differs from the adult population in two ways: it has a lower percentage of foreign‑born individuals (8.3% for children, compared with 27.0% for adults) and a higher percentage of individuals born in Canada to at least one foreign‑born parent (29.2% of all children, compared with 15.4% of the adult population).
| Generation status | Age | |
|---|---|---|
| 0 to 14 years | 15 years and older | |
| percent | ||
| Total — Generation status | 100.0 | 100.0 |
| First generation | 8.3 | 27.0 |
| Second generation (two foreign-born parents) | 18.7 | 8.1 |
| Second generation (one foreign-born parent, one Canadian-born parent) | 10.5 | 7.3 |
| Third generation or more | 62.5 | 57.6 |
| Source: Statistics Canada, Census of Population, 2016. | ||
Children reflect new immigration trends
Children with an immigrant background differ from adults with regard to their country of ancestry, reflecting the different places of birth of immigrants over the last few decades. Similar trends were also observed among young adults (15 to 34 years).
The majority of children under the age of 15 (74.0%) were from an Asian country of ancestry, an American country of ancestry (excluding the United States) or an African country of ancestry. This proportion was 68.4% for individuals between the ages of 15 and 34.
However, a greater proportion of the population of older adults with an immigrant background was from European countries and the United States. Almost half (46.1%) of the population between the ages of 35 and 64 and almost 70% of the population aged 65 and older were from a European country of ancestry and the United States.
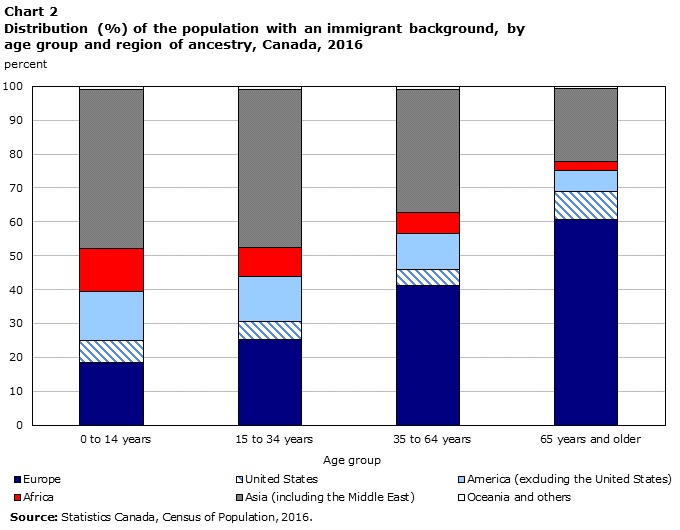
Data table for Chart 2
| Age group | 0 to 14 years | 15 to 34 years | 35 to 64 years | 65 years and older |
|---|---|---|---|---|
| percent | ||||
| Europe | 18.5 | 25.2 | 41.2 | 60.6 |
| United States | 6.4 | 5.3 | 4.8 | 8.3 |
| America (excluding the United States) | 14.5 | 13.5 | 10.3 | 6.4 |
| Africa | 12.6 | 8.4 | 6.3 | 2.6 |
| Asia (including the Middle East) | 47.0 | 46.5 | 36.4 | 21.6 |
| Oceania and others | 1.1 | 1.1 | 0.8 | 0.6 |
| Source: Statistics Canada, Census of Population, 2016. | ||||
Nearly 15% of children with an immigrant background lived in a multigenerational household
Children with an immigrant background are from countries of ancestry with often different cultural characteristics than the characteristics of the majority of the Canadian population, such as language, religion, eating habits and intergenerational relationships.
The family environment is the main vehicle for transmitting the culture of origin to children. The more relatives in a household, the more effective the transmission of the culture of origin.Note 2 For most immigrants living in Canada, the traditional family system of their country of origin involves several generations living within the same household.Note 3
Children born in Canada to at least one foreign‑born parent (second generation in Canada) were most likely to live in a multigenerational household. In 2016, 18.2% of children born in Canada to two foreign‑born parents and 9.5% of Canadian‑born children with one foreign‑born parent were living in multigenerational households.
By comparison, 6.4% of foreign‑born children (first generation in Canada) lived in a multigenerational household. This proportion was the same as that of Canadian‑born children whose two parents were born in Canada (third generation or more).
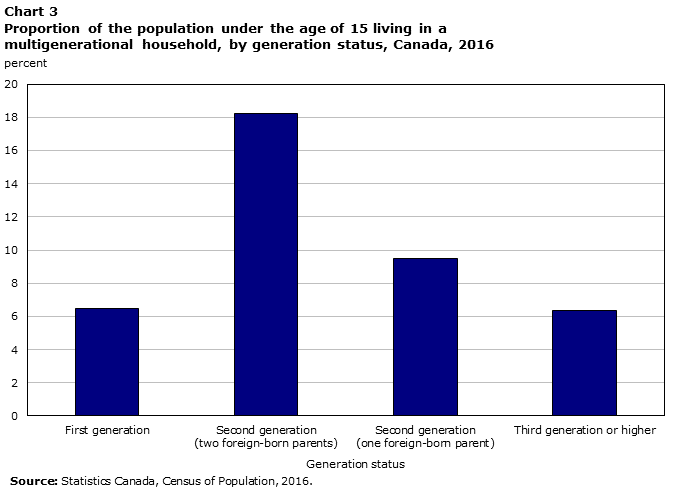
Data table for Chart 3
| Generation status | Percent |
|---|---|
| First generation | 6.4 |
| Second generation (two foreign-born parents) |
18.2 |
| Second generation (one foreign-born parent) |
9.5 |
| Third generation or higher | 6.4 |
| Source: Statistics Canada, Census of Population, 2016. | |
More than one‑third of children with an immigrant background speak only one official language at home, compared with less than 10% of their parents
Studies on the language of immigrants generally look at the linguistic integration of these immigrants,Note 4 but they also examine parent‑to‑children language transmission.Note 5 Often overlooked, however, is the fact that children are agents of linguistic integration for their parents, either because parents encourage them to speak the language of the host country at home to help them do well in school or because the children introduce these languages into their household through school and friends.
In 2016, among census families with at least one foreign‑born parent whose mother tongue is an immigrant language, a higher proportion of children under the age of 15 with an immigrant background spoke only English or French at home than their parents.
However, language practices vary with the census family structure.
The official languages are used at home much more frequently in lone‑parent families and in families with only one foreign‑born parentNote 6 than in families in which both parents are foreign‑born. Children are more likely than their parents to speak only English or French at home. However, foreign‑born parents are more likely than their children to speak an immigrant language together with an official language at home.
In two‑parent families where only one parent is foreign‑born, the fact that the other parent is Canadian by birth means that an official language is naturally adopted in the household in most cases. As a result, learning and using the immigrant language among these children is impeded.
In families composed of two foreign‑born parents with the same immigrant mother tongue, the use of an immigrant language along with an official language is considerable among parents (64.0%) as well as their children (53.2%). A constant remains, however: a higher proportion of children than parents spoke only English or French. Among these children, 24.4% spoke only one official language at home, a percentage 10 times higher than their parents (2.5%). Conversely, 22.3% of these children spoke only a non‑official language at home, compared with 33.5% of their parents.
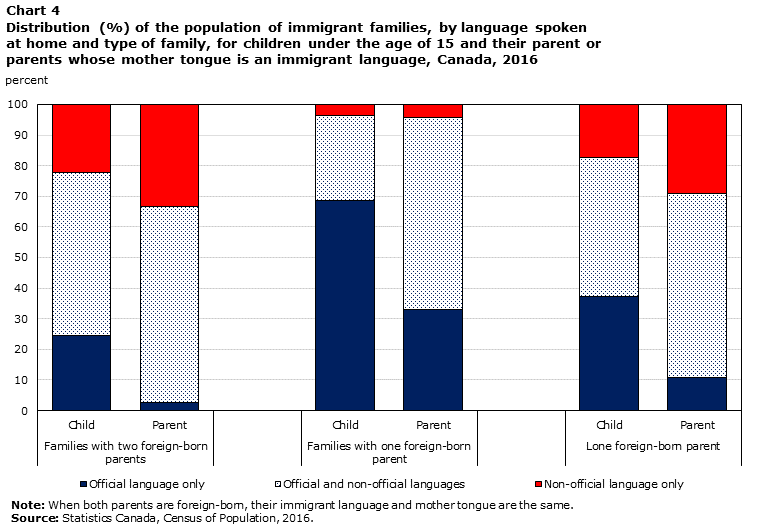
Data table for Chart 4
| Families with two foreign-born parents | Families with one foreign-born parent | Lone foreign-born parent | ||||
|---|---|---|---|---|---|---|
| Child | Parent | Child | Parent | Child | Parent | |
| percent | ||||||
| Non-official language only | 22.3 | 33.5 | 3.9 | 4.2 | 17.4 | 29.1 |
| Official and non-official languages | 53.2 | 64.0 | 27.7 | 62.6 | 45.2 | 60.1 |
| Official language only | 24.4 | 2.5 | 68.5 | 33.1 | 37.4 | 10.9 |
|
Note: When both parents are foreign-born, their immigrant language and mother tongue are the same. Source: Statistics Canada, Census of Population, 2016. |
||||||
Data sources, methods and definitions
Data sources
The data in this analysis are from the 2016 Census of Population. Further information on the census can be found in the Guide to the Census of Population, 2016, Catalogue no. 98‑304‑X.
Additional information on the quality and comparability of census data on immigration can be found in the Place of Birth, Generation Status, Citizenship and Immigration Reference Guide, Census of Population, 2016, Catalogue no. 98‑500‑X2016007.
Methods
Random rounding and percentage distributions: To ensure the confidentiality of responses collected for the 2016 Census, a random rounding process is used to alter the values reported in individual cells. As a result, when these data are summed or grouped, the total value may not match the sum of the individual values, since the total and subtotals are independently rounded. Similarly, percentage distributions, which are calculated on rounded data, may not necessarily add up to 100%.
Because of random rounding, counts and percentages may vary slightly between different census products, such as the analytical documents, highlight tables and data tables.
Definitions
This document looks at children, i.e., the population of daycare‑age, primary school‑age and secondary school‑age individuals in 2016. For this reason, this report deals with the population aged 0 to 14 years.
Children with an immigrant background are defined by generation status, which was derived from questions on the respondent’s place of birth and the parents’ place of birth. Children with an immigrant background comprise three groups: foreign‑born children, Canadian‑born children with two foreign‑born parents, and Canadian‑born children with one Canadian‑born parent and one foreign‑born parent. The other children belong to the third generation or more: these children were born in Canada to two parents who were also born in Canada.
Country of ancestry is also derived from questions on the respondent’s place of birth and the parents’ place of birth. For foreign‑born individuals, it refers to the country in which the person was born. For Canadian‑born individuals with at least one foreign‑born parent, it refers to the country in which that parent was born. In the event that the country of birth of two foreign‑born parents differs, the mother’s country was used.
Multigenerational household refers to a household with at least three generations, namely grandparents, parents and children of the same family line living under the same roof.
Immigrant language refers to a language (other than English and French, the country’s official languages) whose existence in Canada is originally due to immigration after English and French colonization. This term excludes Aboriginal languages and sign languages, in addition to English and French. It must not be associated with the concept of the “language of immigrants.”
Immigrant family refers to a census family in which at least one spouse or parent is foreign‑born.
For more information on the concepts, definitions and variables used in the 2016 Census of Population, please consult the Dictionary, Census of Population, 2016, Catalogue no. 98‑301‑X.
Additional information
Additional analysis on immigration and ethnocultural diversity can be found in The Daily of October 25, 2017, and in the Census in Brief articles entitled Ethnic and cultural origins of Canadians: Portrait of a rich cultural heritage, Catalogue no. 98‑200‑X2016016, and Linguistic integration of immigrants and official language populations in Canada, Catalogue no. 98‑200‑X2016017.
Additional information on immigration and ethnocultural diversity can be found in the Highlight tables, Catalogue no. 98‑402‑X2016007; the Data tables, Catalogue nos. 98-400-X2016184 to 98-400-X2016215; the Census Profile, Catalogue no. 98‑316‑X2016001; and the Focus on Geography Series, Catalogue no. 98‑404‑X2016001.
A brief historical picture of changes in Canada’s immigration source countries can be found in the Video centre.
Two infographics are also available. Immigrant population in Canada shows some of the key findings, mainly on the place of birth of immigrants and recent immigrants to Canada. The second infographic, Gateways to Immigration in Canada, shows the main admission programs under which immigrants have come to Canada since 1980.
For details on the concepts, definitions, and variables used in the 2016 Census of Population, please consult the Dictionary, Census of Population, 2016, Catalogue no. 98‑301‑X.
In addition to response rates and other information on data quality, the Guide to the Census of Population, 2016, Catalogue no. 98‑304‑X, provides an overview of the various phases of the census, including content determination, sampling design, collection, data processing, data quality assessment, confidentiality guidelines and dissemination.
Acknowledgments
This report was prepared by René Houle and Hélène Maheux of Statistics Canada’s Social and Aboriginal Statistics Division, with the assistance of Mireille Vézina, Jean‑Pierre Corbeil and other staff members of that division, and the collaboration of staff members from the Census Subject Matter Secretariat, the Census Operations Division, and the Communications and Dissemination Branch.
- Date modified: