
Archived Content
Information identified as archived is provided for reference, research or recordkeeping purposes. It is not subject to the Government of Canada Web Standards and has not been altered or updated since it was archived. Please contact us to request a format other than those available.
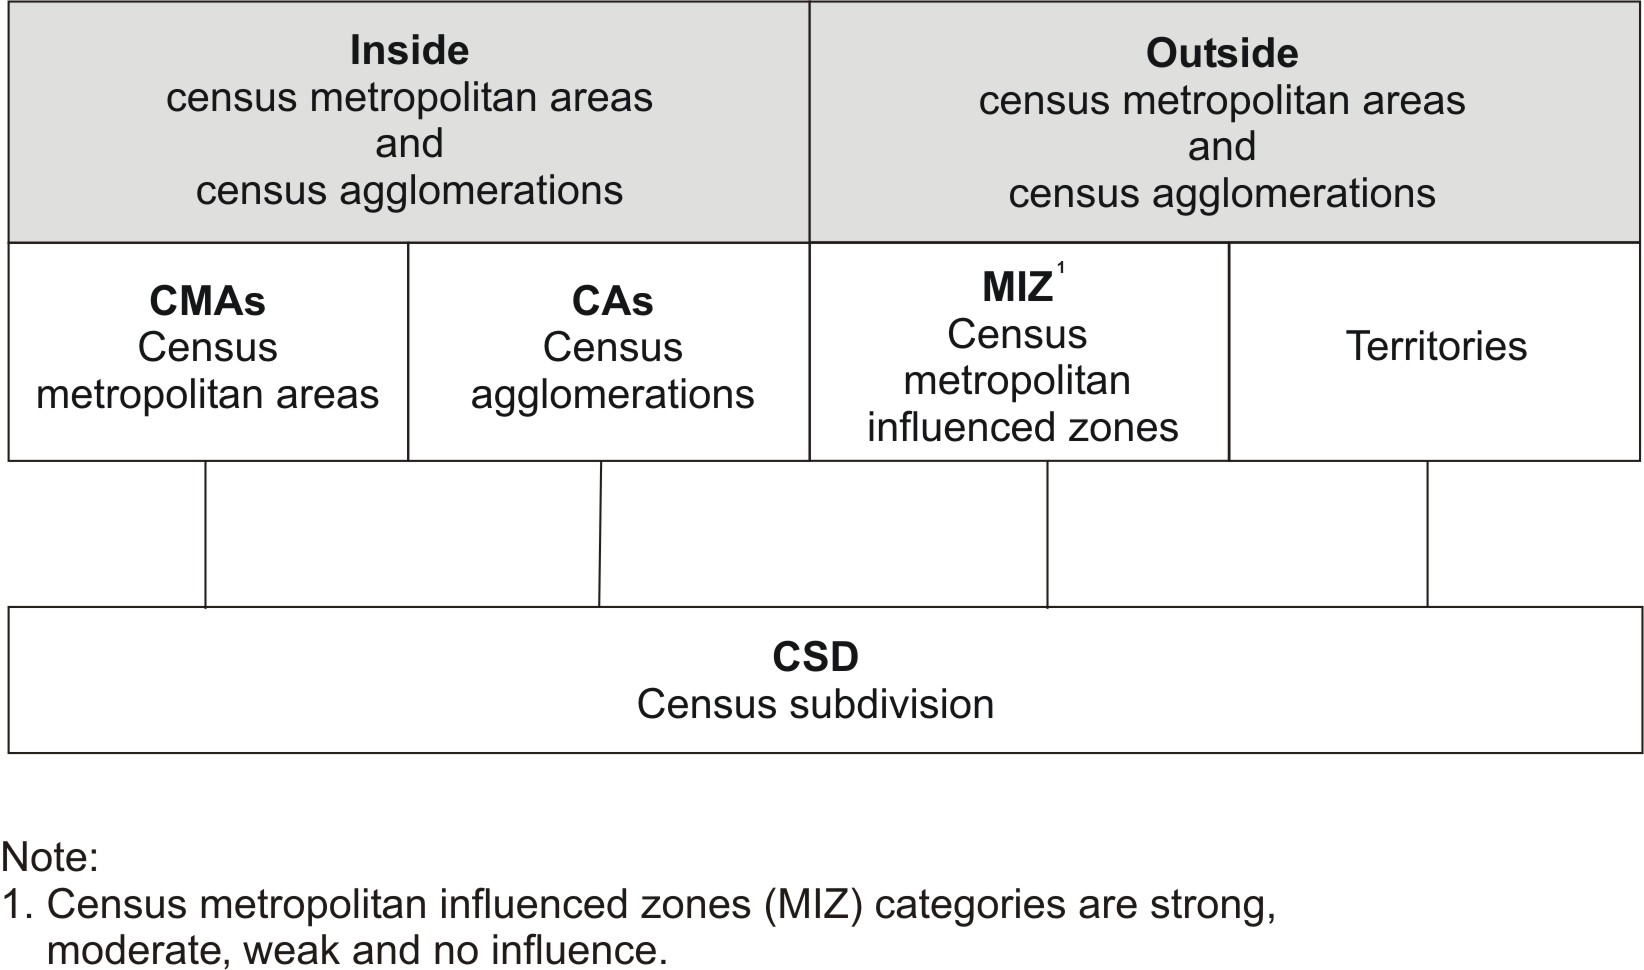
Figure 3 Statistical Area Classification (SAC) hierarchy
Description
Figure 3 is a graphical representation of the hierarchy of geographic areas that make up the Statistical Area Classification (SAC). The top level of the hierarchy appears as a pair of grey boxes positioned side by side. The box on the left is labelled 'Inside census metropolitan areas and census agglomerations' and the box on the right is labelled 'Outside census metropolitan areas and census agglomerations.'
Below the grey box on the left (Inside census metropolitan areas and census agglomerations) are two white boxes positioned side-by-side which represent the next level down in the hierarchy. The box on the left is labelled 'CMAs Census metropolitan areas' and the box on the right is labelled 'CAs Census agglomerations.'
Below the grey box on the right (Outside census metropolitan areas and census agglomerations) are two white boxes positioned side-by-side which also represent the next level down in the hierarchy. These white boxes are the equivalent level as those described in the preceding paragraph (CMAs and CAs). The box on the left is labelled 'MIZ Census metropolitan influenced zones' and the box on the right is labelled 'Territories.' The acronym MIZ (census metropolitan influenced zones) is footnoted with 'Census metropolitan influenced zones (MIZ) categories are strong, moderate, weak and no influence.'
Below the four white boxes described above is one box that represents the lowest level in the SAC hierarchy. It is labelled 'CSD Census subdivision' and is linked to each of the four white boxes above it with a single line for each white box.
For more information on this figure, please contact Statistics Canada at 1-800-263-1136.
Source: Statistics Canada, 2011 Census of Population.
- Date modified: