
Archived Content
Information identified as archived is provided for reference, research or recordkeeping purposes. It is not subject to the Government of Canada Web Standards and has not been altered or updated since it was archived. Please contact us to request a format other than those available.
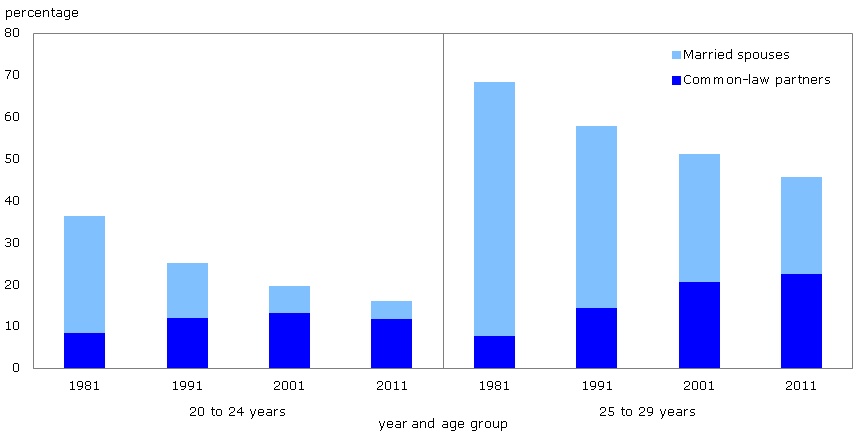
Figure 2
Percentage of young adults aged 20 to 24 and 25 to 29 in couples by conjugal status, Canada, 1981 to 2011
Description
The title of the graph is "Figure 2 Percentage of young adults aged 20 to 24 and 25 to 29 in couples by conjugal status, Canada, 1981 to 2011".
This is a column stacked chart.
There are in total 8 categories in the horizontal axis. The vertical axis starts at 0 and ends at 80 with ticks every 10 points.
There are 2 series in this graph.
The vertical axis is "percentage".
The horizontal axis is "year and age group".
The title of series 1 is "Common-law partners".
The minimum value is 7.7 and it corresponds to "25 to 29 years 1981".
The maximum value is 22.6 and it corresponds to "25 to 29 years 2011".
The title of series 2 is "Married spouses".
The minimum value is 4.3 and it corresponds to "20 to 24 years 2011".
The maximum value is 60.7 and it corresponds to "25 to 29 years 1981".
| Age group and year | Common-law partners | Married spouses |
|---|---|---|
| 20 to 24 years, 1981 | 8.4 | 28.0 |
| 20 to 24 years, 1991 | 11.9 | 13.2 |
| 20 to 24 years, 2001 | 13.1 | 6.6 |
| 20 to 24 years, 2011 | 11.8 | 4.3 |
| 25 to 29 years, 1981 | 7.7 | 60.7 |
| 25 to 29 years, 1991 | 14.3 | 43.5 |
| 25 to 29 years, 2001 | 20.6 | 30.5 |
| 25 to 29 years, 2011 | 22.6 | 23.1 |
| Sources: Statistics Canada, censuses of population, 1981 to 2011. | ||
Sources: Statistics Canada, censuses of population, 1981 to 2011.
- Date modified: